Markets are attracted to Fibonacci resistance/support areas. This websites 12/22/22 blog noted two S&P 500 (SPX) Fibonacci retracement points. At SPX 3,841.94 and 3,843.90, this resistance was reached on 12/23/22.
The SPX – 15 – minute chart courtesy of Trading View shows what happened.
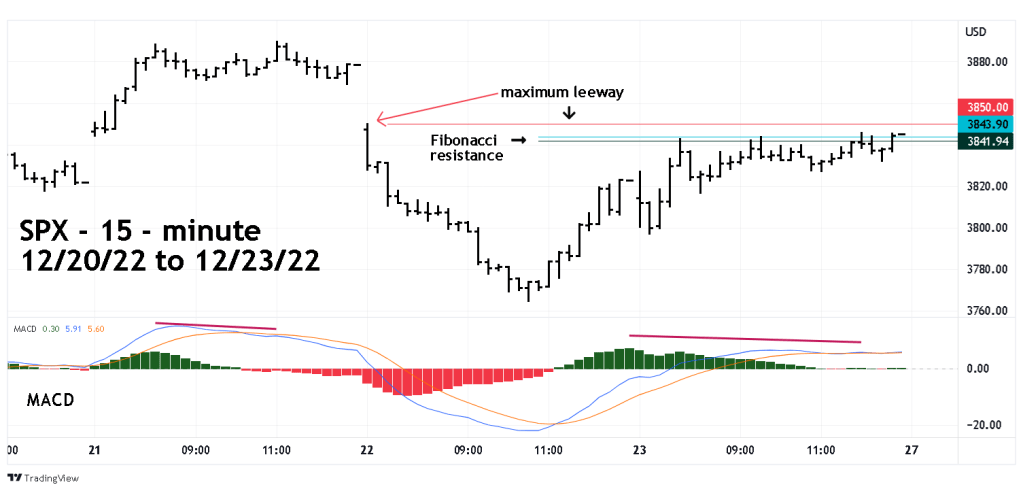
Exact hits of Fibonacci coordinates are rare, therefore allow for leeway around support/resistance areas. There is no standard method to determine leeway, it can vary based on various factors. In this situation SPX 3,850 was used because it was where the steep SPX decline began on 12/22/22.
The SPX high on 12/23/22 was 3,845.80, within the leeway zone and only 1.90 points above the upper Fibonacci coordinate. We can assume a short-term top could be in place. Momentum evidence supports this assumption. Note the MACD – Histogram bearish divergence at the SPX high of the day.
There’s a good chance the SPX could decline on 12/27/22. The last week of the year has low volume because most of the big money traders are on vacation. U.S stocks could be in a narrow trading range during the last four trading days of 2022. There may not be any big moves until the first trading day of 2023 – 01/03/23.
People from 105 countries have viewed “Four Dimension Trading.
To those that are celebrating the upcoming holiday. Merry Christmas!
To everyone, peace and goodwill!
Mark
