Today 12/15/22 the S&P 500 (SPX) broke below an important bottom made on 11/17/22 at 3,906.54. Additionally, the decline from 4,100 appears to be a developing Elliott Impulse wave which implies the primary trend may now be bearish.
The daily SPX chart courtesy of Trading View illustrates the intermediate – term view.
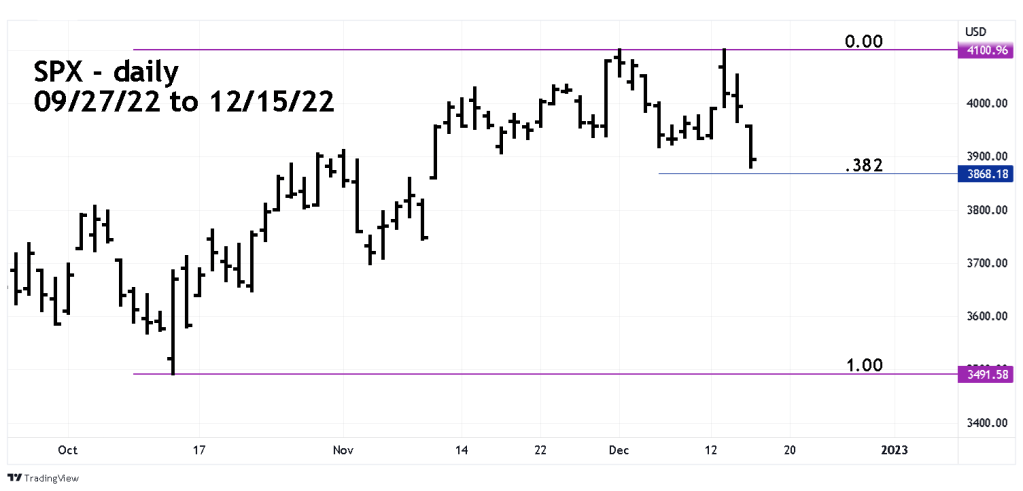
The SPX broke below the bottom made on 12/06/22, and the prior lower bottom at 3906.54 made on 11/17/22. This is the first time since the rally began on 10/13/22 that two support levels have been breached. The SPX low today was close to a Fibonacci .382 retracement of the rally from 10/13/22 to 12/13/22.
The 5- minute SPX chart shows this level could be reached on 12/16/22.

The decline from 4,100 so far has very clear Elliott wave subdivisions, what’s in doubt is the presumed Minute wave “iv”. If Minute wave “iv” goes higher the most likely target zone surrounds a .382 retracement of the presumed Minute wave “iii”. The bulls – eye level is 3946, a move above 3970 would be suspicious as most fourth waves have shallow retracements.
If Minute wave “iv” has reached its highest level, then Minute wave “v” would most likely be in effect. The bulls – eye level for Minute wave “v” could be 3868.18 which is the .382 retracement of the SPX 10/13/22 to 12/13/22 rally.
The bottom for Minute wave “v” could occur on 12/16/22, if so it could be the prelude to a multi-day rally.
