Within the first ten – minutes of the S&P 500 (SPX) session on 12/16/22 there were two bottoms made. The first was at almost exactly 3,868.18 which was Fibonacci support noted in this websites prior blog. The second bottom was at 3,863.74. Subsequently there was a rally that lasted ten – minutes, the SPX then declined below 3,863.74 which was a major clue that the SPX could be headed down to the next significant Fibonacci support zone.
The daily SPX chart courtesy of Trading View updates the action.

The 3,868.18 level is a Fibonacci .382 retracement of the October to December rally, the break below this level opened the door for a move down to the next Fibonacci point which is a .50 retracement of the October to December rally at 3,796.27.
Momentum evidence suggests the SPX could in the near-term, trend lower. Note that on 12/16/22 the MACD – Histogram was lower than the reading on 12/09/22. Usually the MACD – Histogram will signal a potential trend change with a divergent reading. Note the action in late September.
There’s also another very interesting Fibonacci coordinate that needs to be noted. There are always alternate Elliott wave counts. One alternate count could be an Expanding Flat forming from the 12/01/22 peak. In an Expanding Flat wave “c” – notated in purple, usually has a Fibonacci relationship of 1.618 to wave “a” – noted in purple.
In this case the presumed wave “a” is 182.12 points, multiplied by 1.618 equals 294.67.
The presumed wave “b” high at 4,100.96 minus 294.67 targets SPX 3,806.29 as potential Fibonacci support.
The 3,806.29 secondary coordinate is close to the primary .50 coordinate at 3,796.27. Two close Fibonacci coordinates represent strong support/resistance and increase the chance that at least a short-term bottom could be made in the 3,796 to 3,806 zone.
The SPX – 15-minute chart zooms in on the intraday action.
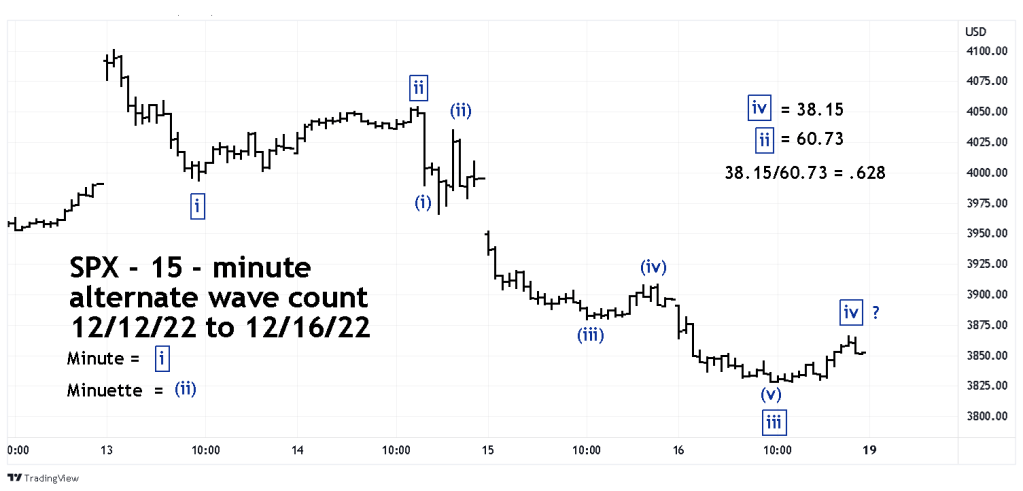
Its possible that the presumed five wave pattern down from the 12/13/22 top could still be under construction. Within a motive pattern there’s usually a Fibonacci relationship between waves “two” and “four”. In this case the presumed Minute wave “iv” is almost .618 of the presumed Minute wave “ii”.
There’s a good chance that on 12/19/22 the SPX could continue going lower. If the SPX goes below 3,785 it opens the door for a move down to the next significant Fibonacci coordinate. Which is at 3,724 – a .618 retracement of the October to December rally.
