On 12/06/22 the S&P 500 (SPX) broke below important support made on 11/29/22, wiping out all of the gains made during the powerful 11/30/22 rally. Additionally, the decline from the 12/01/22 peak at 4,100 has the look of a developing Elliott – Impulse wave. If so, this could be the first wave down of a developing larger five – wave decline.
The hourly SPX chart courtesy of Trading View illustrates the action.
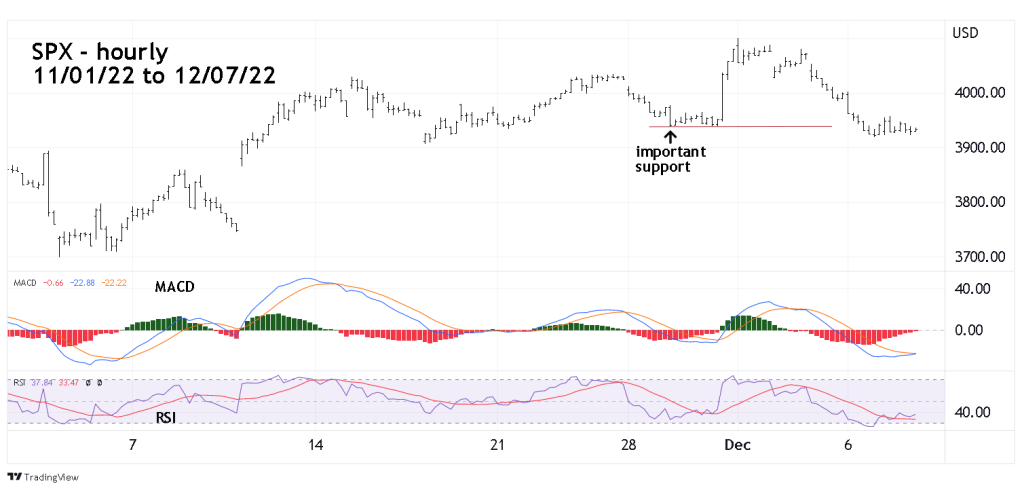
Note the rally after the 12/06/22 bottom was choppy and shallow, which is what you would expect of a correction within a downtrend. The price action since the 12/06/22 bottom could be a developing Elliott wave – Horizontal Triangle which appear in the fourth wave of Elliott motive patterns. The movement after the 12/06/22 bottom is where a potential fourth wave should be in relation to the drop from 12/01/22.
On 12/06/22 the hourly RSI and MACD reached levels that indicate the SPX may have made or is nearing a bottom. If on 12/08/22 the SPX moves below the bottom made on 12/06/22, the hourly RSI and/or the MACD could have bullish divergences.
If an important SPX top was made on 12/01/22, its possible 12/14/22 could be a secondary lower peak. The next FOMC meeting/announcement is on 12/14/22, US stocks could rally into, and then turn down on the 12/14/22 announcement.
