So far the S&P 500 (SPX) has been able to have two daily closes above the 200 – day moving average (MA). This was probably a factor in bringing in buying at the open of the 12/02/22 session. There’s still one potential resistance barrier to overcome – the declining trendline from the January 2022 all-time high.
The daily SPX chart courtesy of Trading View illustrates the action.
On 12/01/22 the SPX broke marginally above the trendline but closed below the line. Short- term evidence noted in the prior blog implied the SPX could rally on 12/05/22. If so, and the SPX is able to close above the trendline on 12/05/22, there’s a good chance it could trigger additional stock buying.
A breakthrough of the trendline opens the door for a move back to at least the SPX 08/16/22 high. The upper end of the price zone is about where the final portion of an Elliott wave – Expanding Flat could terminate. Prior blogs have noted that an Expanding Flat may have begun at the SPX bottom made on 06/17/22. If so, wave “C” may have started at the 10/13/22 bottom. Wave “C” in Expanding Flats end marginally beyond the termination points of wave “B” – this case the 08/16/22 high. If the current SPX rally continues a future blog will examine this theory in greater detail.
The broad time zone for a potential top is from 12/12/22 to 12/23/22. The next FOMC meeting/announcement is on 12/14/22, sometimes significant stock market turns occur on FOMC announcements. If US stocks continue to rally after 12/14/22 the next new moon is on 12/23/22. Occasionally market trend changes come on or near new/full moons. For stock markets new moons tend to signal tops.
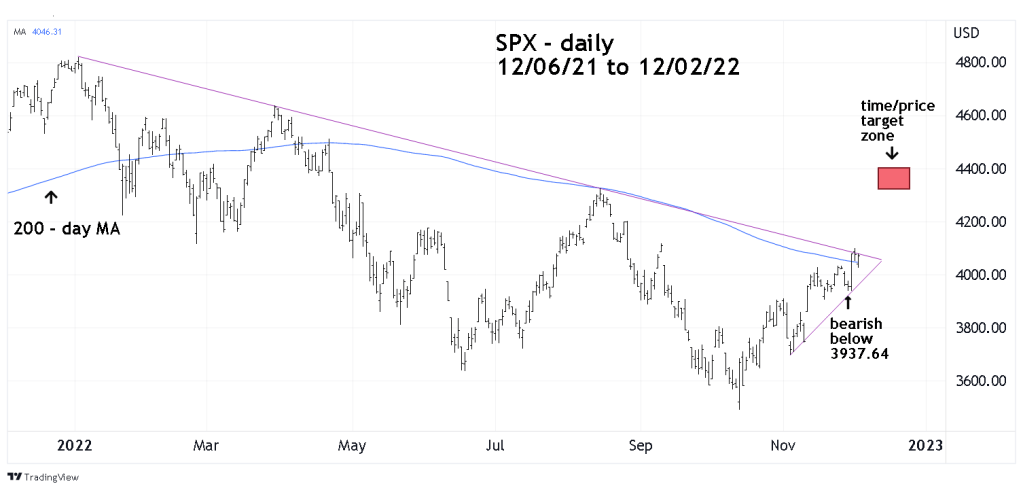
The most important support level is the bottom made on 11/29/22 at 3,937.64. A move below this point would wipe out all of the gains from the powerful 11/30/22 rally and could open the door for a retest of the 10/13/22 bottom.
