The 11/17/22 blog illustrated S&P 500 support/resistance using the Volume Profile indicator on the S&P 500 – E-Mini futures – contract symbol (ESZ2022). The 11/18/22 blog updates the support/resistance areas and gives a brief tutorial on using the Volume Profile indicator.
The 30-minute S&P – 500 – E- Mini futures chart ESZ2022 updates the price and volume action.
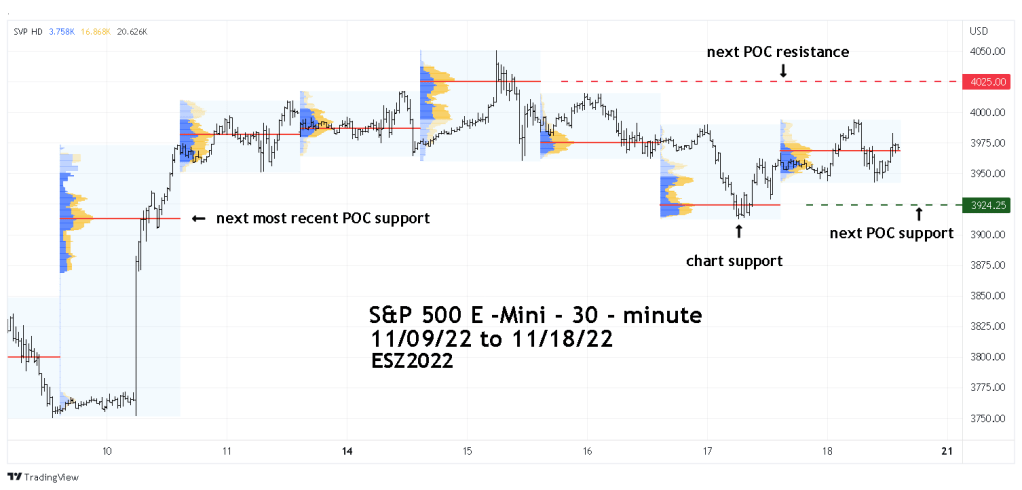
The widest part of a Volume Profile is the area of greatest supply/demand, called the Point of Control (POC) which can be support/resistance points.
The 11/17/22 blog noted that the next potential resistance could be at ESZ2022 – 3,976.00. This was the POC for the 11/16/22 session. On 11/18/22 price moved decisively above 3,976.00. When price moves beyond the POC, the next most recent POC becomes potential support/resistance. In this case the next POC resistance area is at 4,025.00 from the 11/15/22 session.
What about the next support area? Normally the POC from the current session could be support/resistance. However, note that at the close of the main session on 11/18/22 the price was only slightly above the POC. Price will either move away from or moves towards POC. If on 11/21/22 price is below the 11/18/22 POC, support could be at the next most recent POC, which in this case is at 3,925.00 from the 11/17/22 session.
If price can break below the 3925.00 level there’s also chart and POC support at 3,913.00. A move below this level could open the door for a move down to the low 3,800 area.
Thursday November 24th is the U.S Thanksgiving day holiday. There could be slow trading for most of next week. The next blog will examine an Elliott wave pattern that could develop during the week of 11/21/22 to 11/25/22.
