This blog is an update to the S&P 500 (SPX) Elliott wave count posted on 11/09/22.
The 30 – minute SPX chart courtesy of Trading View updates the action.
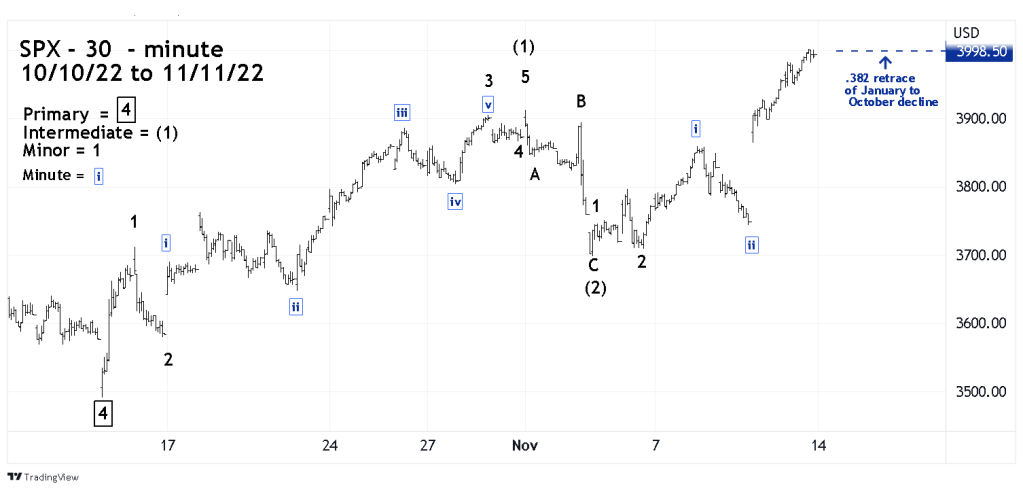
The presumed Intermediate wave (2) bottomed on 11/03/22 and retraced almost an exact Fibonacci .50 retrace of Intermediate wave (1). The subsequent rally appears to be another developing impulse wave. The powerful move up of the prior two trading days looks like a third of a third wave – which is usually the most dynamic phase of stock market impulse patterns.
Today 11/11/22 the SPX moved marginally above the Fibonacci .382 retrace of the 2022 decline. There’s a good chance of profit taking on 11/14/22, if so the decline could be short and shallow – lasting one or two trading days.
There’s a high probability the SPX could continue its rally into mid – December 2022. The next blog will examine when in December a significant SPX top could occur.
