The 11/05/22 blog “Follow the Leader” noted that the Dow Jones Industrial Average (DJI) was the most bullish of the three main US stock indices, and to watch its 200 – day moving average (MA). Today, 11/10/22 the DJI has decisively broken above two resistance points implying the rally could continue for several weeks.
The prior blog “S&P 500 – Short -Term Elliott Wave Forecast – 11/09/22” noted that the S&P 500 (SPX) decline from the 11/01/22 top could terminate on 11/10/22 or 11/11/22. The very bullish action on 11/10/22 implies that the presumed Intermediate wave (2) probably bottomed on 11/03/22. The powerful rise today – 11/10/22 looks like it’s the mid portion of Intermediate wave (3) up, which is usually the most dynamic part of an Elliott impulse wave.
The daily DJI chart courtesy of Trading View updates the action.
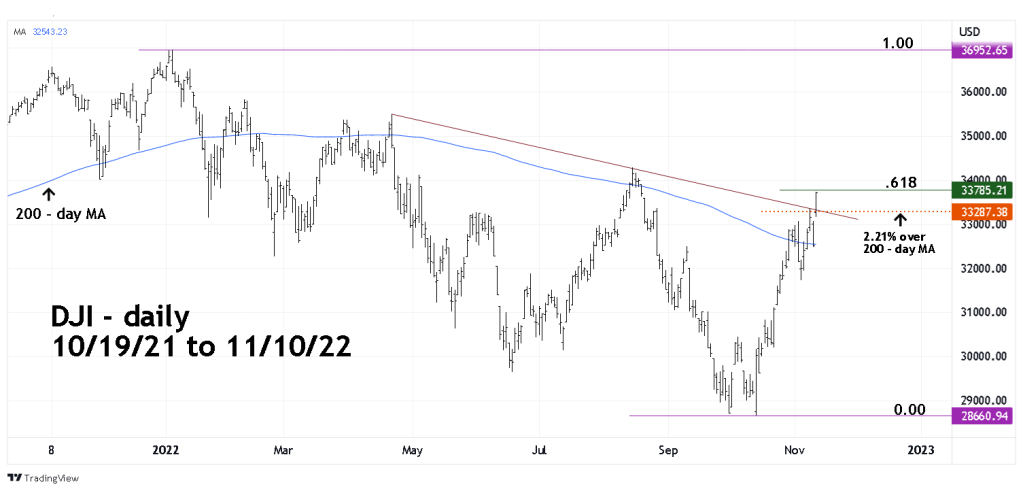
The 11/05/22 blog noted that a 2.21% move above the 200-day MA could be a bullish breakout. On 11/08/22 the DJI moved above this level and then stopped exactly at the declining trendline connecting the 04/21/22 and 08/16/22 tops. The subsequent drop appeared it could continue for several days. Today’s huge rally decisively blasted above the trendline and potential 200 – day MA resistance.
At the close of the 11/10/22 session the DJI was just below the Fibonacci .618 retracement of the 2022 bear move.
Considering the strength of the 11/10/22 move up and the break above two resistance levels, there’s a very good chance the DJI could also push above the potential .618 resistance.
If the DJI can push over the .618 resistance, it could move to a new all-time high by early to mid-December 2022.
