Weekly momentum and daily sentiment indicators show that stock market bears could be losing strength.
The blog “Dramatic Reversal – 10/13/22” noted that S&P 500 (SPX) daily Stochastic, RSI , and MACD all had bullish divergences. Longer – term momentum oscillators also have bullish divergences.
The weekly SPX chart courtesy of BigCharts.com illustrate the additional evidence.
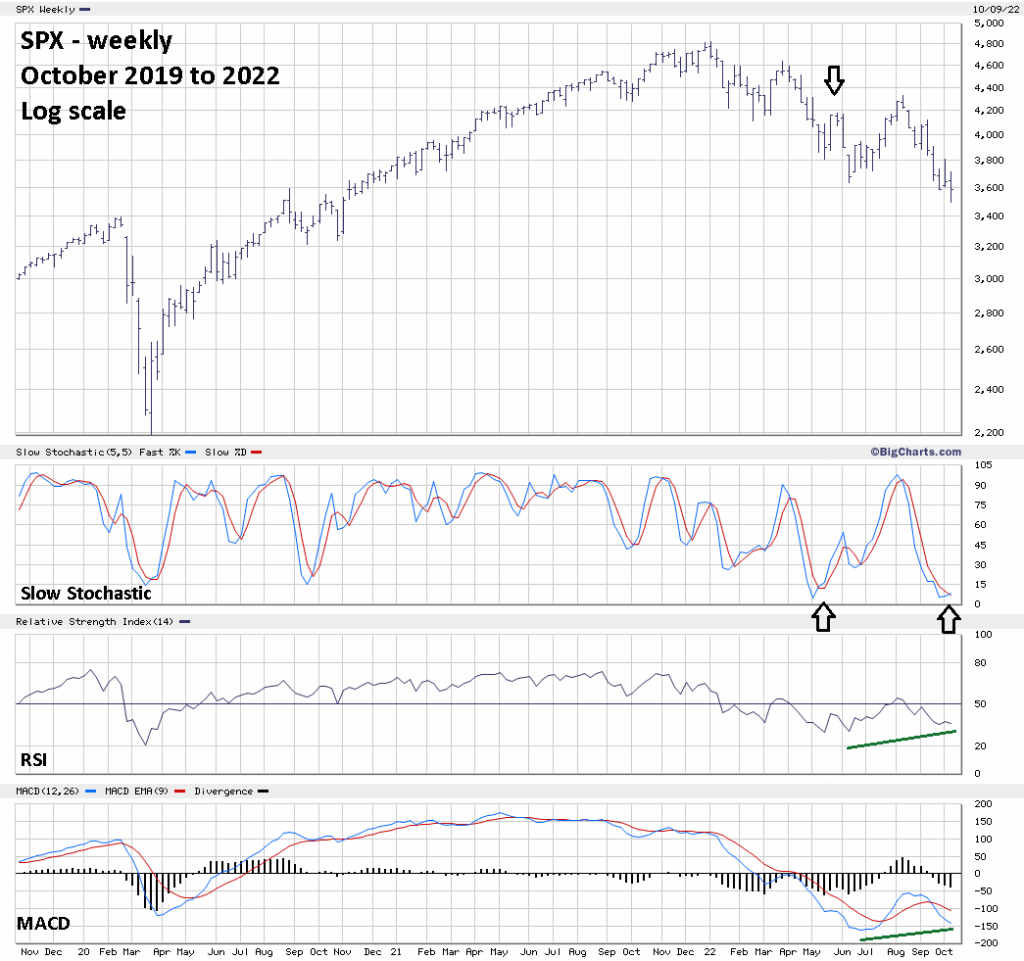
Weekly MACD has bullish divergence on both the Histogram and lines. The RSI has a bullish divergence vs. the mid – June 2022 and late September readings.
BigCharts.com Slow Stochastic is very effective in spotting trend changes on any time scale. Weekly Slow Stochastic as of mid – October was very oversold and had a bullish lines crossover. Note the deep oversold reading in May 2022 and the subsequent bullish lines crossover. This signal preceded a two-week rally. There’s a high probability the current signal could herald at least a two- week rally.
The daily SPX chart courtesy of Trading View updates two sentiment indicators.
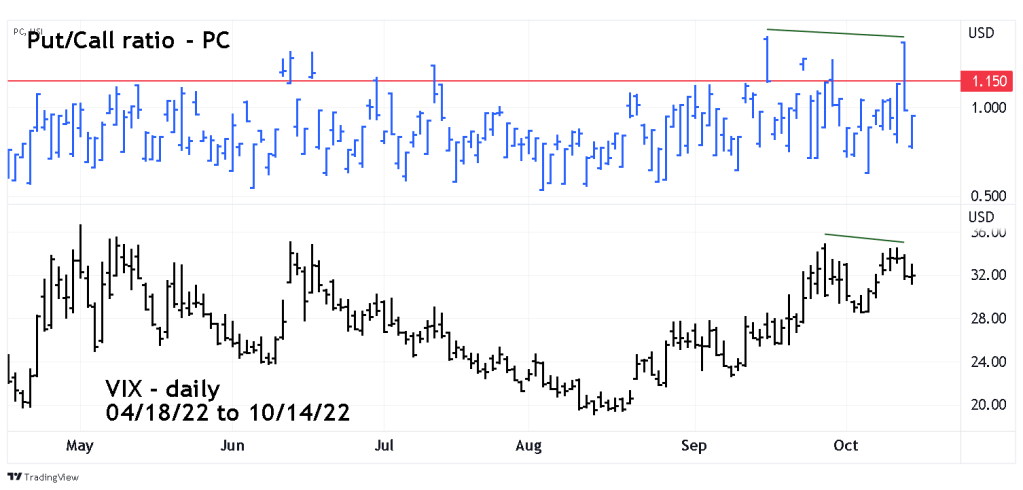
The top chart is the Put/Call ratio – Trading View symbol (PC). Investors Business Daily uses readings above 1.15 as a signal for potential US stock market bottoms.
On 10/13/22 PC went above the 1.15 level and diverged against the mid-September reading. This shows a lessening of panic which is fascinating from two aspects. First, SPX prices were lower on 10/13/22 vs. the 09/16/22 PC reading. Second, the SPX drop percentage on 10/13/22 was greater than on 09/16/22. Both of these factors should be generating greater fear and a higher PC reading.
Of course, in the near-term the PC ratio could spike above its 09/16/22 level. For now, there is a divergence and a hint that perhaps stock market sentiment is shifting to the bullish side.
Data from the daily VIX also shows a bullish divergence, confirming the PC reading.
The biggest factor in favor of the bears is the calendar. Mid – October is when some of the largest drops in the US stock market have occurred.
There are not many US economic reports due from 10/17/22 to 10/21/22. The reports that are coming this week are usually not big market movers. Unless some unexpected bearish event occurs, there’s a high probability that US stocks could rally for at least two weeks.
