For several months interest rates in the US have been surging higher, they could soon be reaching an intermediate peak.
The monthly 30 – year CBOE Treasury Bond Yield (TYX) chart courtesy of Trading View illustrates the long-term view.

TYX is nearing a Fibonacci .236 retracement of the colossal 39 – year bear market that lasted from October 1981 to March 2020. TYX on 10/19/22 reached 4.132, the exact .236 retracement level is 4.229, which is also near a triple top that formed between June 2009 and February 2011.
Monthly Stochastic has reached the over bought zone. Monthly RSI has reached 78.07, this is the highest reading since March of 1980 at 88.35.
This chart is Arithmetic scale which is effective at illustrating Fibonacci retracements. To understand the size of the TYX rally since March 2020 we need to examine a Logarithmic chart which is effective in illustrating large percentage gains.
The monthly Log scale TYX chart shows the percentage gain of the post March 2020 rally vs. the prior secular bear market.
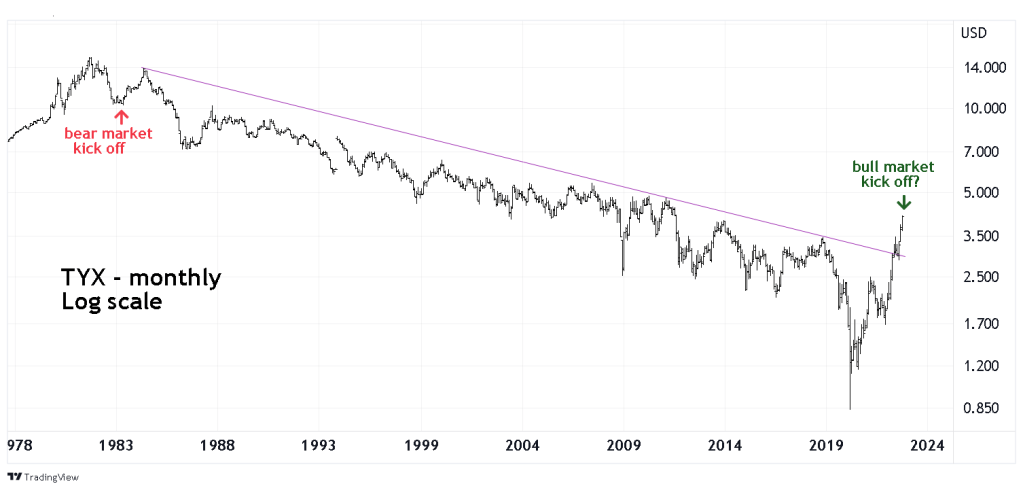
The size of the bull move since March 2020 dwarfs every rally from October 1981 to March 2020. Additionally, TYX has pushed above a multi – decade declining trend line. Both of these factors are powerful evidence that a multi-year or even a multi- decade bull market has probably begun.
If there’s an interest rates top, the subsequent decline could continue for several months.
If US interest rates decline it could be a catalyst for US stocks to rally.
