The 09/28/22 blog concluded with this note, “It’s too soon to declare a double bottom is in place vs. the June bottoms. Let’s see what the bears can do on 09/29/22.”
Subsequently the S&P 500 and the Dow Jones Industrial Average (DJI) made new bear market lows while the Nasdaq Composite (IXIC) and Russell 2000 (RUT) are still above their respective June 2022 bottoms.
This blog updates the action of RUT along with momentum and sentiment indicators.
The daily RUT chart courtesy of Trading view updates the price action.
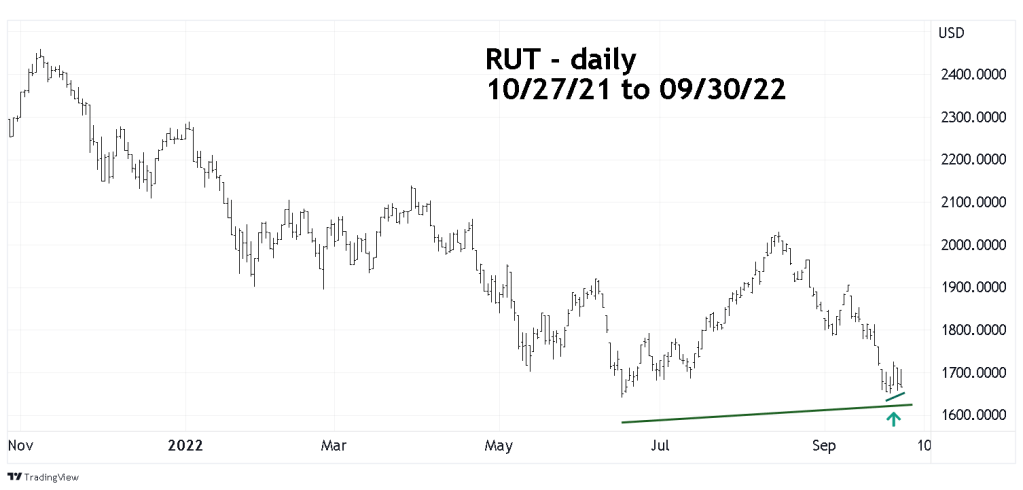
On 09/29/22 RUT held above its 09/27/22 bottom. On 09/30/22 RUT could not exceed even its 09/29/22 bottom. This is fascinating because RUT is composed of small cap stocks and at its June 2022 bottom was down 33.1% vs, 24.5% for the SPX.
Currently, why is RUT not leading the way down?
The daily chart – US New Highs – New Lows (5 – day total; EOD) ($USHL5) courtesy of StockCharts.com updates internal US stock market momentum.

$USHL5 has broken below its 06/17/22 bottom yet still has a significant bullish divergence vs. its May 2022 low. Additionally, in the final two September trading days while the SPX was making new bear market lows, $USHL5 went up.
The daily chart of NYSE – New 52 – Week Lows ($NYLOW) illustrates an extraordinary bullish divergence.
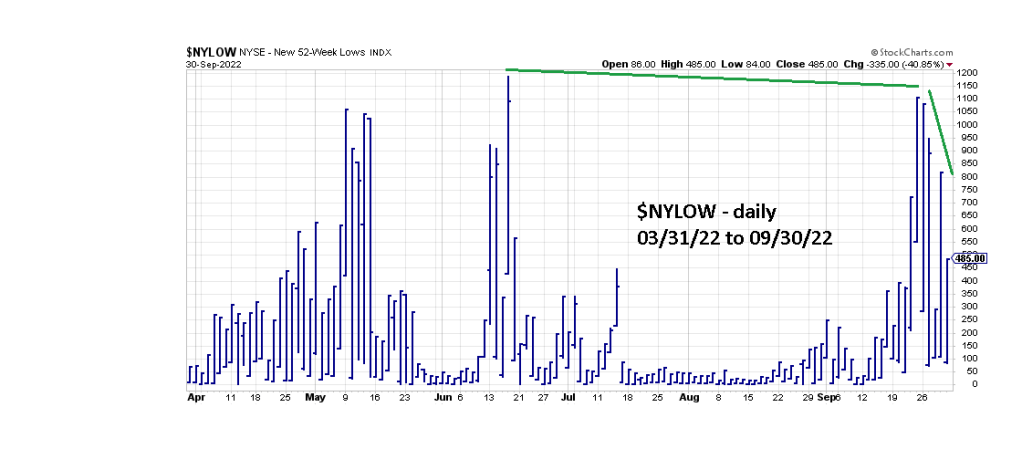
In late September the NYSE index (NYA) made new bear market lows yet, $NYLOW not only had a bullish divergence vs. it’s mid- June readings – new lows collapsed!
The daily VIX and Put/Call ratio (PC) chart updates US stock market sentiment.

The 09/24/22 blog “Round Trip” noted that the rising VIX illustrated increasing panic while the PC drop showed decreasing panic. Since then both the VIX and PC are down from their near -term peaks implying a decrease in panic and a possible short-term rally for US stocks.
The SPX and DJI moves to new bear market lows implies a continuation of the bear market. The RUT’s bullish divergence along with bullish sentiment and momentum readings implies at least a short-term stock rally could be imminent.
The next blog will examine bullish SPX alternate Elliott wave counts.
