As of 09/30/22 momentum and sentiment evidence implied the S&P 500 (SPX) could be forming a double bottom vs. its mid – June 2022 low. This blog examines two possible Elliott wave alternate bullish counts.
In Elliott wave theory there are always at least two alternate wave counts, bearish and bullish. Frequently there can be several interpretations of bearish or bullish counts.
Currently the SPX appears it could form a double bottom with the low made in June 2022, this opens the possibility that an Elliott wave – Expanding Flat could be developing.
Expanding Flats are corrective waves to the primary trend, which in this case is down. Expanding Flats are composed of three – waves. The first wave “a” subdivides into three waves. The second wave “b” also subdivides onto three waves with the termination point of wave “b” slightly exceeding the wave “a” point of origin. The third wave “c” subdivides into five- waves either an impulse wave or occasionally an Ending Diagonal Triangle. The termination point of wave “c” slightly exceeds the wave “b” point of origin.
After the Expanding Flat the primary trend resumes, with the SPX ultimately making new bear market lows.
The daily SPX chart courtesy of Trading View illustrates a potential developing Expanding Flat.
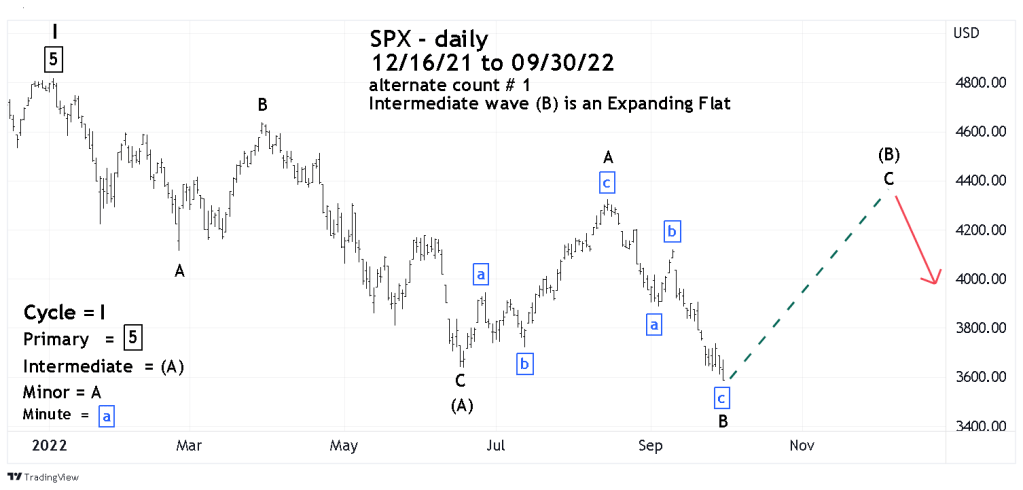
Note the rally from 06/17/22 to 08/16/22 subdivides into three waves. The 08/16/22 to presumed 09/30/22 bottom also subdivides into three waves. If a bottom was made on 09/30/22 a rally could continue for two months. This is proportionate to the presumed Minor wave “A” rally from 06/17/22 to 08/16/22. Arguing against this theory is that US stocks would have to rally throughout October – a month notorious for large and steep declines.
The next SPX daily chart shows a less bullish alternate wave count.
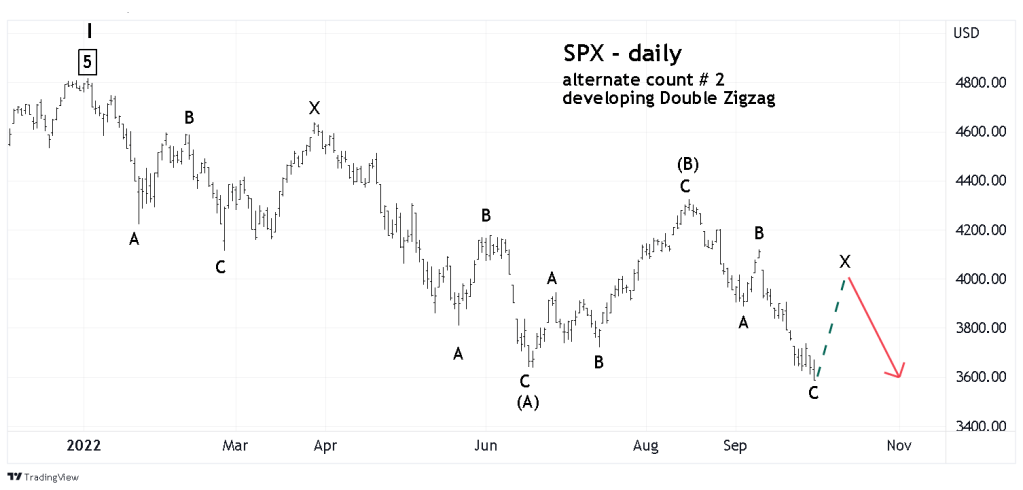
Several blogs have noted the choppy nature of the SPX decline since January 2022. The bear market is taking the form of a complex corrective pattern, a Double Zigzag or even a Triple Zigzag. A Double Zigzag itself could be composed of a lower degree Double Zigzag . This composition could continue down to even lower degrees.
The 08/16/22 to 09/30/22 could be the first Zigzag of a developing Double Zigzag. If so, if a bottom has been made on 09/30/22 the next rally could continue for only one or two weeks. The presumed rally only partially retracing the move down from 08/16/22 to 09/30/22.
After completion of the rally – Minor wave “X” the primary trend resumes , with the SPX ultimately making new bear market lows.
Arguing in favor of this theory is the seasonally bearish month of October and the possibility of a sharp steep decline.
The fundamentals driving stocks down are relatively high inflation and rising interest rates. There would probably have to be some other event that’s not factored into the market to cause a rapid decline of 10, 15 or even 20%.
If no other event occurs, the SPX base upon the sentiment and momentum evidence has a good chance to rally back to the 08/16/22 high.
October 3, 2022 is the first trading day of the final quarter of 2022. Let’s see what the stock bears can do.
