The 07/21/22 blog “S&P 500 – Elliott Wave Count – 07/21/22” noted that the 2022 US stock market decline was taking a complex pattern similar to the 2000 to 2002 bear market. The January to June 2022 S&P 500 (SPX) drop was a complex and choppy pattern.
The Elliott wave guideline for alternation among waves is “to expect something different”. If the first phase of a larger developing bear market completed at the 06/17/22 bottom then perhaps the second phase of the bear market could be simple and smooth.
This current blog examines the possibility that the second phase of a larger developing bear market began at the 08/16/22 peak, and where the SPX could be in the Elliott wave cycle.
The daily SPX chart courtesy of Trading View illustrates a possible alternative bearish wave count.

In Elliott wave theory there’s always at least one alternate wave count. If your primary wave count is bullish, you must have an alternate bearish count. This is perhaps the most important aspect of Elliott wave theory; it helps the analyst maintain objectivity.
For the sake of clarity, the January to June decline is illustrated in its most basic Elliott wave formation. Also, this illustration designates the August 2022 peak as Intermediate wave (X). The 07/21/22 blog illustrated a possible August 2022 top as Intermediate wave (B). Both designations have the same meaning; an intervening rally between two decline phases.
The important point to focus on is the action subsequent to the 08/16/22 top. The Minor waves “1” and “2” could be the first part of larger five – wave pattern down. The decline after the 09/12/22 could be a developing third wave down – possibly wave “one” of three”. The middle part of third waves, “three of three” are usually very powerful moves – up or down.
The SPX 06/17/22 bottom could be very strong support and it could require a powerful force to break through.
The next daily chart shows the SPX relative to lunar phases.
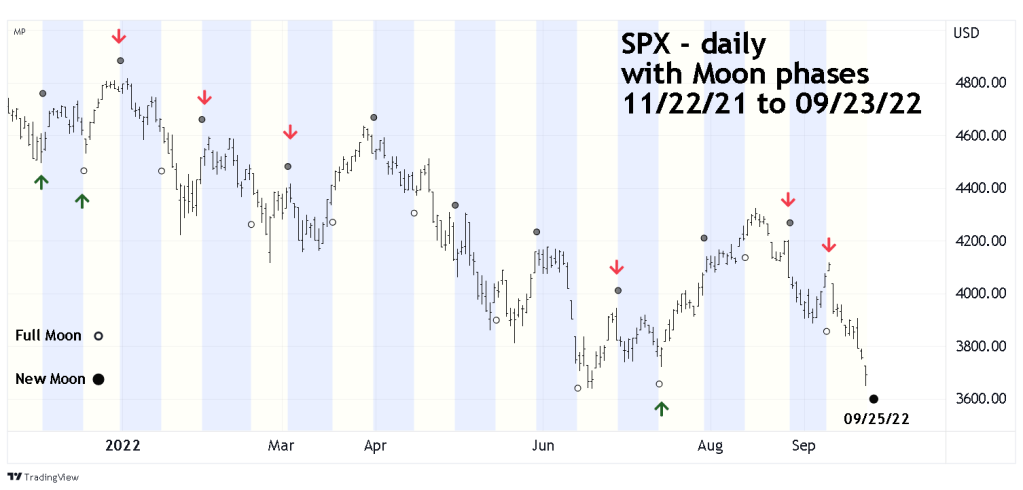
Markets can occasionally have turns on or near Full/New Moons. This illustration shows effective turns that have occurred within plus or minus two trading days of a New/Full Moon.
In stock markets, tops generally occurs on New Moons, bottoms at Full Moons. This theory is supported by the data on the chart. There were nine effective lunar turns. Of the six New Moon signals, five were tops one was a bottom. Of the three Full Moon signals two were bottoms one was a top. There’s a New Moon on 09/25/22. With US stock trending down into the plus or minus two trading day zone it implies a likely bottom.
A summary of the evidence from the four market dimensions is as follows.
Momentum: The prior blog noted increased bearish momentum. However, on 09/23/22 only one of the three main US stock indices, the Dow Jones Industrial Average broke below its June bottom. The Nasdaq Composite held above its 06/16/22 bottom and the SPX failed to break its 06/17/22 bottom. This is a bullish divergence until at least one of the other two indices break their respective June bottoms.
Sentiment: The prior blog noted the Put/Call ratio illustrated decreasing panic while the VIX showed increasing panic. The message from the two indicators is inconclusive.
Price: If either the Nasdaq Composite or the SPX break below their June bottoms it increases the chances there could be at least an additional 10% drop.
Time: October has seen many large stock market declines. However, there could be an effective lunar cycle bottom already in place, or within the next two – trading days..
What happens in the last week of September 2022 could determine if an intermediate bottom is in place, or large drop of at least 10%.
