On 09/23/22 the S&P 500 (SPX) came very close to important support at the 06/17/22 bottom. The SPX low on 09/23/22 reached a 98.4% retracement of the 06/17/22 to 08/16/22 rally. This round trip is very close to the Fibonacci ratio of 1/1 or 100%. A decisive break below the SPX 06/17/22 bottom could open the door for much more downside action.
The daily – US New Highs minus New Lows (5 – day total; EOD) ($USHL5) chart courtesy of StockCharts.com updates internal momentum.

The decline in US stocks during the prior three trading days has come with an increasing number of stocks making new lows. $USHL5 as of 09/23/22 only has a marginal bullish divergence vs. the SPX relative to the 06/17/22 bottom.
The next StockCharts.com chart updates the Cumulative SPX Advance/Decline line ($SPXADP).

The situation is similar to $USHL5 and implies the bears are gaining strength.
The daily Put/Call (PC) courtesy of Trading View updates US stock market sentiment.
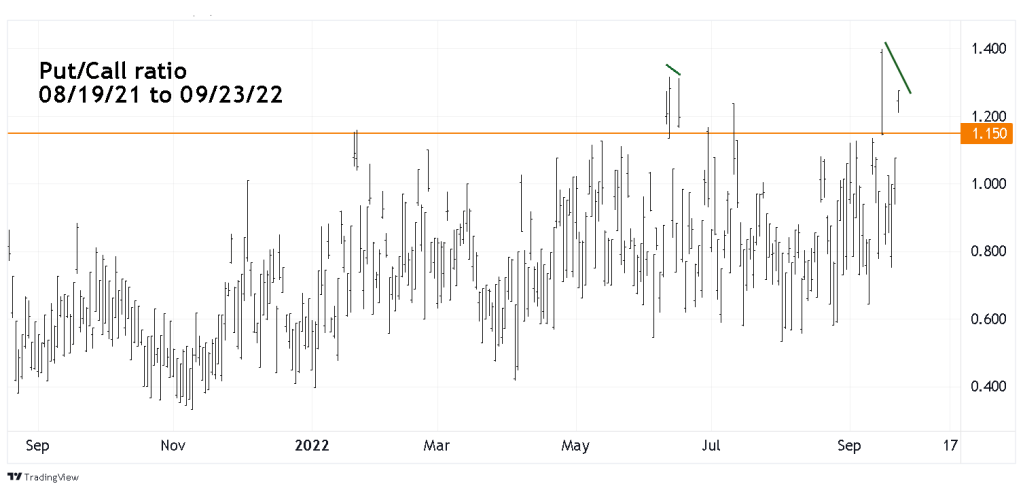
“Investor’s Business Daily” uses PC readings above 1.15 as an indication of a potential stock market bottom. On 09/16/22 PC spiked to 1.398 the highest level in over a year. On 09/23/22 with the SPX at a lower price, PC was at a lower level than at 09/16/22 indicating a lessening of the panic. This is a potential bullish signal – note the similar occurrence just prior to the 06/17/22 bottom.
The daily – VIX and SPX chart updates the action of this pair since 09/16/22.

The blog “A Review of Sentiment Indicators – 09/16/22” noted that the VIX was not near the high levels associated with SPX bottoms. Subsequently VIX has moved higher and with the aid of Bollinger Bands indicates that a spike above the upper band could correspond to an SPX bottom. The down arrows indicate premature upper band break out signals.
However, note that on 09/23/22 the VIX reached a higher level than the 09/21/22 spike. This implies increasing panic and contradicts the decreasing panic message of the Put/Call ratio.
Since 09/16/22 the bears have gained strength. The big question is – can they break below the 06/17/22 bottom? A decisive break below this important support could trigger a sharp drop down to the SPX 3,200 level.
The next blog will examine a potential SPX Elliott wave count and other factors.
