On the FOMC interest rate announcement day, US stocks continued to decline. The daily S&P 500 (SPX) – RSI bullish divergence was eliminated. This blog updates the actions of two internal momentum indicators.
The daily chart courtesy of StockCharts.com examines US New Highs minus New Lows (5-day total – end of day) StockCharts.com symbol ($USHL5).
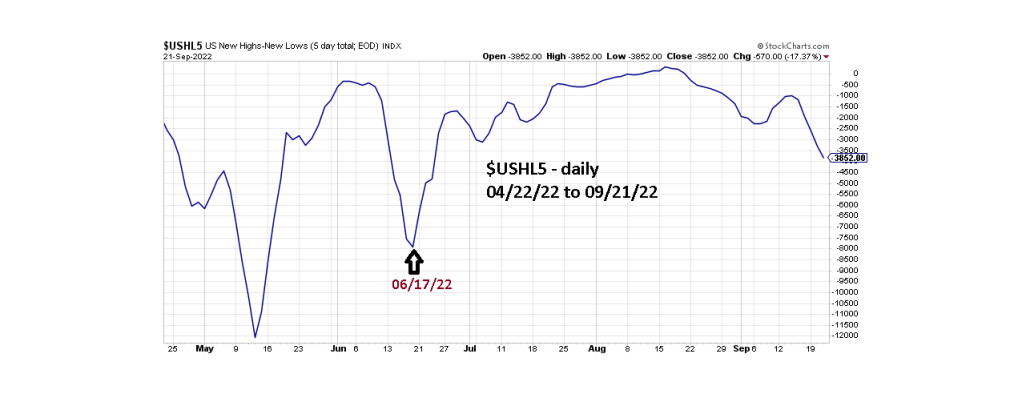
$USHL5 has broken below its 09/06/22 bottom although its still declining slower than the SPX, As of 09/21/22 $USHLH had retraced 52% of its move up from the 06/17/22 bottom, while the SPX has retraced 77%.
This is an update of the cumulative daily SPX – Advance/Decline line chart – StockCharts.com symbol ($SPXADP).

This indicator also broke below its 09/06/22 level and is also declining slower relative to the SPX. A 70% retracement of the rise from the 06/17/22 bottom vs. a 77% SPX retracement.
The Put/Call ratio on 09/21/22 reached a high of .998 vs. the high on 09/16/22 of 1.398 – a potential bullish divergence.
The VIX action was inconclusive.
The combination of relatively slow declining momentum, and bullish Put/Call readings imply an intermediate bottom could be approaching. Near – term the door is open for more downside price action.
