Market momentum should at least match or exceed price movements. Momentum divergences imply lack of conviction and could be the prelude to a reversal. This blog updates momentum indicators that were illustrated in the 09/14/22 blog “Erratic Price Movements”.
The daily S&P 500 (SPX) chart courtesy of Trading View examines external momentum.
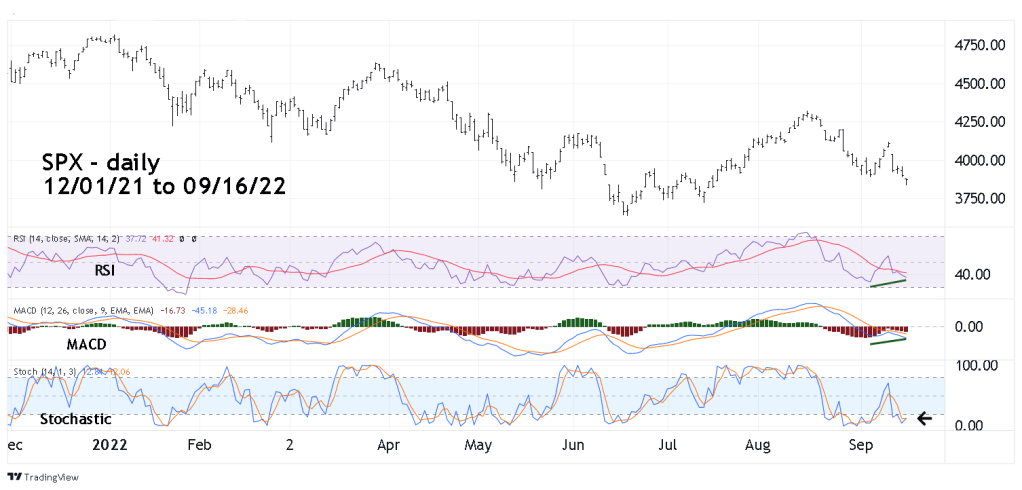
As of 09/14/22 the SPX – RSI had an hourly bullish divergence. With the subsequent SPX break below the 09/06/22 bottom there’s now a daily bullish divergence. However daily RSI has yet to reach the oversold zone below the RSI 30% line. Its possible a near-term rally could be just a pause before a decline that brings the daily RSI into the oversold zone.
Daily MACD has a bullish Histogram divergence. However, the lines have no divergence.
Daily Stochastic has a marginal bullish lines crossover.
The daily chart courtesy of StockCharts.com examines an internal momentum indicator.
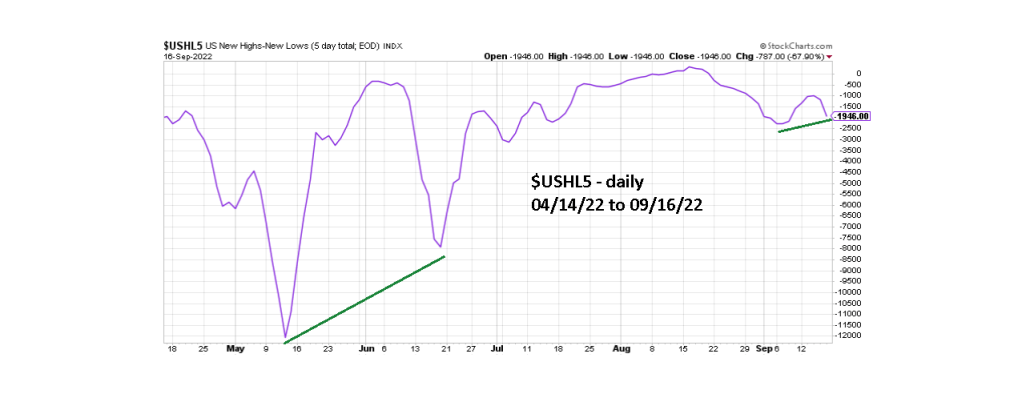
The US New Highs minus New Lows (5-day total – end of day) StockCharts.com symbol ($USHL5) has a bullish divergence vs. the level recorded at the 09/06/22 SPX bottom. Relative to price this divergence illustrates a shocking lack of bearish conviction.
The cumulative daily SPX – Advance/Decline line chart – StockCharts.com symbol ($SPXADP) also shows a bullish divergence vs. the 09/06/22 price bottom.

The weight of evidence from the four market dimensions.
Time: Seasonally bearish from mid-August to late October – strongly bearish.
Price: SPX beak below 09/06/22 bottom and .618 Fibonacci support opens the door for a move down to the 06/17/22 bottom – moderately bearish.
Sentiment: Excessive bearish sentiment from two indicators noted in the prior blog – strongly bullish.
Momentum: Bullish divergences from several indicators – strongly bullish.
Overall, the evidence gives the bulls a small advantage. The very important FOMC interest rate announcement on 09/21/22 could be the deciding factor.
Market forecasting is similar to weather forecasting, and neither is 100% accurate. With weather forecasts evidence can indicate a storm is forming , then it dissipates. If the bullish evidence holds, stock market bears could soon be in a storm.

Impressive write up. The bearish sentiment is as strong as I can remember.
LikeLike
Thanks for the compliment. Yes the bearish sentiment is very strong. If a move up has begun, or will begin in a few days it could become a classic example of too much money being bet on the wrong dirrection.
LikeLike