The S&P 500 (SPX) early in the 08/26/22 session made a marginal new high for the rally that began on 08/24/22. Triggered by comments from FOMC chairman Powell – US stocks then fell sharply. The start of major bear wave down? Indicators and Fibonacci retracement levels reveal some fascinating clues.
The daily SPX chart courtesy of Trading View illustrates the intermediate range view.
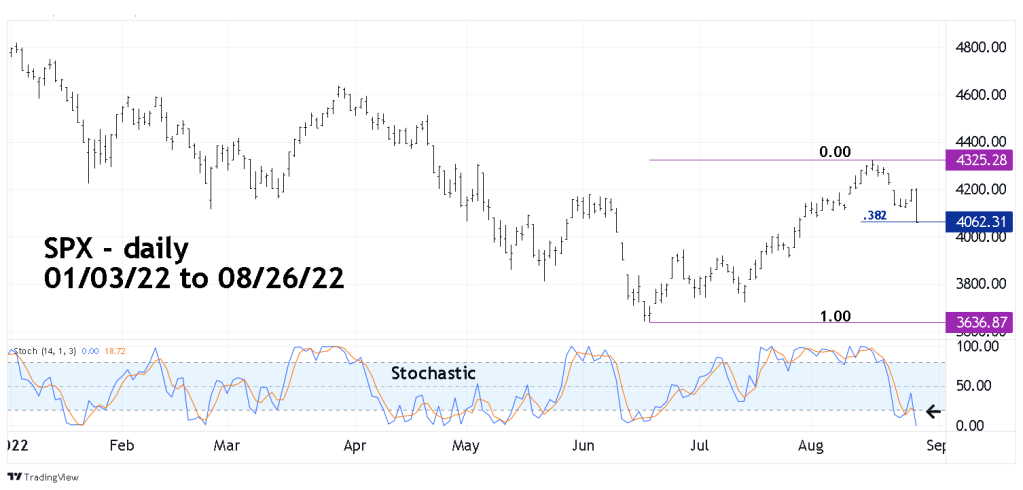
The daily Stochastic which just recently had a bullish lines crossover now has a bearish lines crossover. However, note that the SPX low was just below the Fibonacci .382 retracement of the rally from 06/17/22 to 08/16/22. Fibonacci retracement levels are frequently support/resistance points for market movements.
The daily SPX chart courtesy of BigCharts.com gives a different perspective.

The Slow Stochastic indicator on BigCharts.com is perhaps the most effective Stochastic indicator. Note that the Slow Stochastic has yet to confirm the bearish signal given by the Trading View – Stochastic.
The hourly SPX – Trading View chart illustrates intraday momentum.
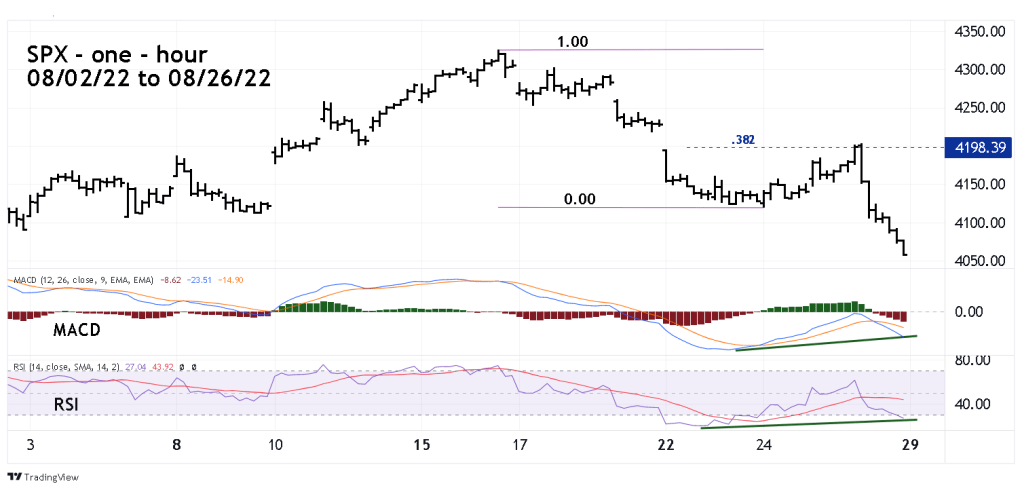
Both the hourly RSI and MACD indicators had bullish divergences at the SPX low on 08/26/22.
Also note that the SPX peak on 08/26/22 was just above a Fibonacci .382 retracement of the 08/16/22 to 08/24/22 decline.
The one – minute SPX Trading View chart focuses on the internal momentum.
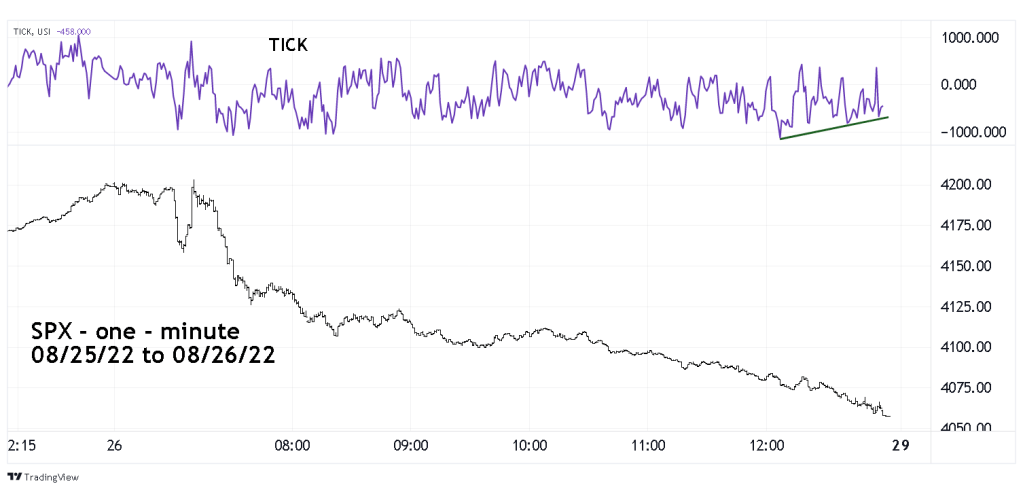
NYSE Cumulative Tick (TICK) measures internal momentum. Note that at the SPX low on 08/26/22 the TICK was considerably higher. The low TICK reading for the day was -1126. The TIC K reading at the SPX low was only -458. This significant bullish divergence indicates bearish exhaustion.
Note – TICK is not in the Trading View file of indicators. Its Symbol is TICK and can be charted like any stock or market index. The TICK illustrated in this blog is a comparison chart of the SPX and TICK.
Near-term evidence suggest there’s a high probability that US stocks could rally on 08/29/22. What about a multi-day rally? The best evidence comes from the daily SPX – RSI.
As noted in the 08/20/22 blog “The Danger Zone” – “With stock indices the RSI usually has at least one bearish divergence signaling a potential price top. Based on extensive studies I’ve done with the RSI on several time scales, the probability is nearly 90%. When RSI is not diverging with price it implies higher prices. This phenomenon applies only to stock indices and is probably the best tool to discovering stock market peaks.”
The SPX post 06/17/22 rally high came with a maximum daily RSI reading. There’s a high probability the SPX could have one more rally that at least marginally exceeds the 08/16/22 high. If this move up has a daily RSI bearish divergence vs. the 08/16/22 reading it could signal an important top.
The prior blog “Rising From a Value Area – 08/25/22” illustrated a target time zone of 08/31/22 to 09/01/22 for a potential SPX rally peak. The dramatic decline on 08/26/22 reduces the chances of a top being made in that time zone. If a multi- day SPX rally develops 09/06/22 could be a topping day. Depending on market action, the reason for a 09/06/22 peak will be examined sometime next week.
