The previous blog “Declining into a Value Area – 08/22/22 presented evidence that US stocks could be finding support on either 08/22/22 or 08/23/22. A bottom was made on 08/24/22 just slightly below the area illustrated on the SP – E-Mini continuous chart. There’s a good chance that a multi-day rally may have commenced.
The 15 – minute S&P 500 (SPX) chart courtesy of Trading View updates the action.
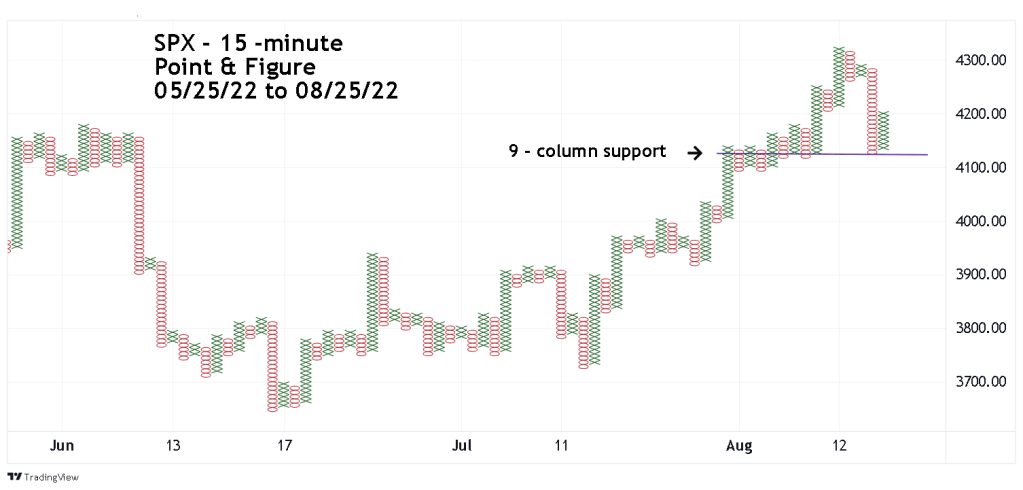
The 08/22/22 blog illustrated the Volume Profile method on the SP 500 continuous E-Mini contract. Using Point & Figure charting also shows a support level. Note that the SPX bottomed at 9 – columns of support.
The daily SPX chart presents additional evidence that a bottom could have been made on 08/24/22.
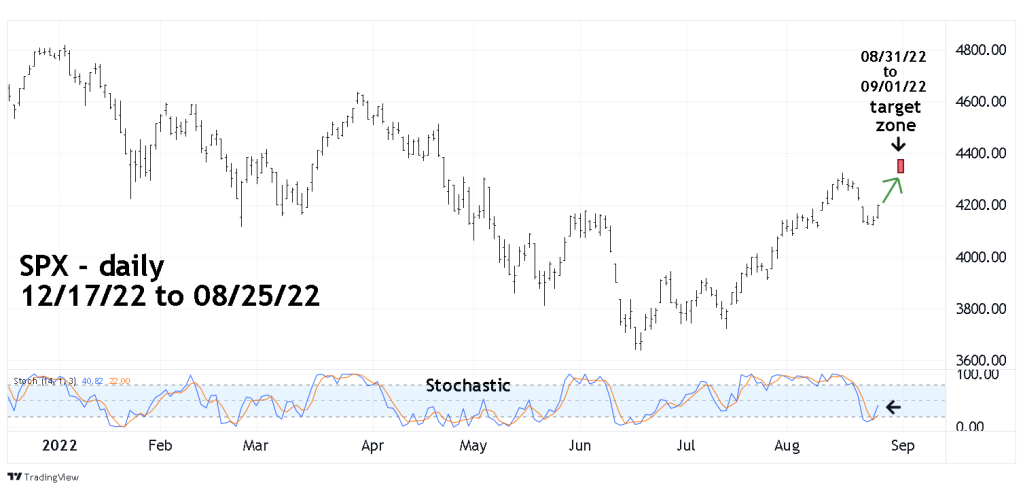
The daily Stochastic bullish lines crossover implies at least a multi-day rally may have begun. It’s possible the SPX could make a marginal new high for the rally that began on 06/17/22. If the SPX can make a marginal new rally high it could be a very important peak.
Depending on market action, additional blogs will examine this theory in greater detail.
