Market momentum oscillators such as Stochastic and RSI can be used to measure the length of a price movement, think of them as fuel gauges. A review of some S&P 500 (SPX) momentum oscillators illustrate the potential remaining fuel.
The monthly SPX chart courtesy of Trading View illustrates long-term momentum.

This chart was first shown in the 07/07/22 blog “Long-Term Momentum Implies Multi – Week Rally” and noted that monthly Stochastic had reached the oversold zone. Also noted was the SPX March to May 2008 rally in which the monthly Stochastic rebounded from the oversold zone. The monthly Stochastic lines readings at the May 2008 peak were 44 and 35. The monthly Stochastic readings as of 07/29/22 were 41 and 28 implies more upside action.
The weekly SPX chart shows Stochastic and MACD indicators.
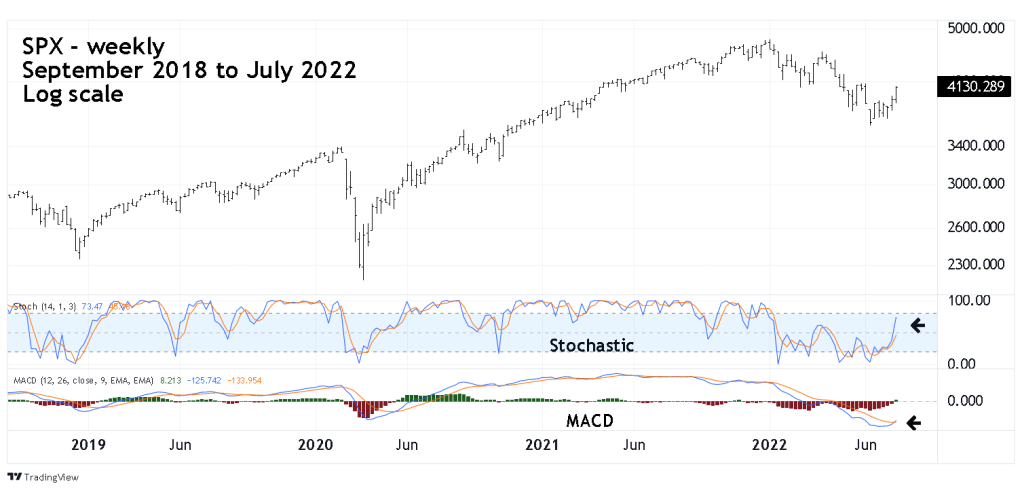
The current weekly Stochastic lines readings are 73 and 45. The weekly Stochastic readings at the May 2008 peak were 99 and 91. Its possible the current weekly Stochastic could also travel into the overbought zone along with higher SPX prices.
The current weekly MACD just had a bullish lines crossover. In April 2008 weekly Stochastic had a bullish lines cross over, SPX peaked six – weeks later. If the current bullish crossover matches the results of 2008 it implies the SPX could top in early September 2022.
The daily SPX chart illustrates Stochastic, MACD, and RSI.
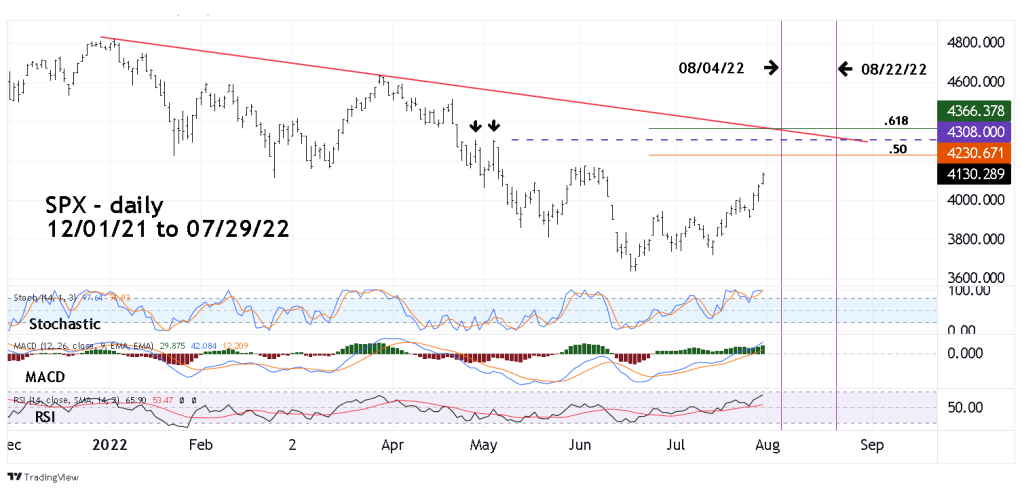
Daily RSI has still not reached the overbought zone – above 70%. Frequently stock market peaks do not occur until RSI is overbought and has at least one bearish divergence.
The time target of 8/04/22 for a potential top was illustrated in the blog “Bullish Breakout – 07/20/22” is based on the daily Stochastic remaining overbought 11 – trading days after 07/20/22. The 08/22/22 time target was featured in the 07/07/22 blog is based on the post 06/17/22 SPX rally matching the SPX March to May 2008 rally.
The down trendline connecting the SPX January and March 2022 tops could act as resistance. Note that in mid to late August the line is near the SPX double peak around 4300.
The combined evidence from Stochastic, RSI and MACD implies the SPX could continue to rally. The most likely rally termination date is 08/22/22. Most likely price resistance is in the low 4300 area.
