The Society of Technical Analysts based in Philippine’s has invited me to speak to their group via zoom about the outlook for the US and Philippine stock markets.
The relationship between the Philippine Stock Exchange (PSEI) and the S&P 500 (SPX) reveals clues relevant to the global stock market.
The monthly PSEI and SPX chart courtesy of Trading View illustrates a multi-decade comparison.
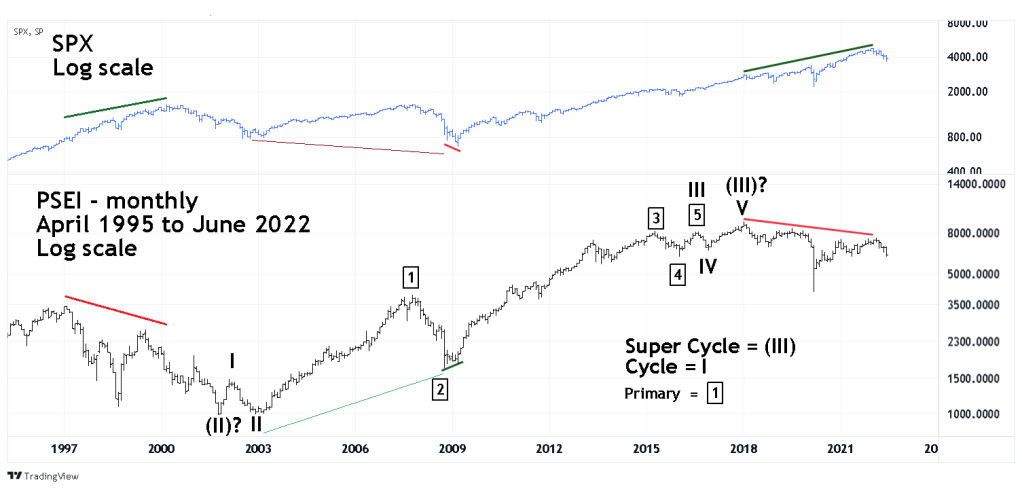
In two instances the PSEI topped years before the SPX. The first was in February 1997, the SPX peaked in March 2000. The second time was in January 2018, the SPX peak was in January 2022. PSEI is perhaps a very early indicator of approaching economic contraction.
On the reverse it also appears to an early indicator of economic expansion. Note the broad bullish divergence when in 2008 the SPX broke below its bottom made in 2002 while the PSEI was significantly above its 2002 low.
Even more interesting is what happened on a shorter-term time scale. Note that the PSEI ultimate bottom of its post October 2007 decline came in October 2008, while the SPX ultimate bottom wasn’t made until March 2009. This was major clue that a global stock bull market could be developing.
From October 2001 to January 2018 the PSEI completed a Super Cycle degree Elliott – impulse pattern. Subsequent to the January 2018 top the PSEI had a three wave decline that completed in March 2020. A case could be made that a multi-year correction of the 2001 to 2018 progress was complete and the move up after the March 2020 bottom is the beginning of a new multi- year bull market.
However, the PSEI had a significant bearish divergence vs. the SPX January 2022 top. It’s more likely that the PSE 2020 to 2022 rally is a countertrend move in an ongoing multi-year bear market.
The weekly PSEI chart illustrates the most likely Elliott wave count subsequent to the January 2018 top.

The 05/28/22 blog “Examination of Two Major Bear Markets” noted that the Dow Jones Industrial Average (DJI) decline since January 2022 was a complex pattern similar to the DJI January 2000 to October 2002 bear market.
Complex correction patterns occur when the sub waves of a correction are themselves corrective patterns. The most common is a Zigzag patterns within the sub waves of a Zigzag- referred to as a Double Zigzag.
If the PSEI weekly wave count is correct, the first Zigzag down is complete at the March 2020 bottom, with a second Zigzag down commencing after the February 2022 top. The presumed second Zigzag down could continue for several years.
The PSEI record of early warning signals, especially the bullish divergences makes it a must watch index for market analysts worldwide.
