The 06/25/22 blog “Nasdaq Composite – MACD Indicator noted that the daily Nasdaq Composite (IXIC) had a bullish MACD lines crossover. Today 06/27/22 the daily S&P 500 (SPX) – MACD also had a bullish lines crossover. This increases the chances for at least a short-term US stock market rally.
The 5 – minute SPX500 – Point & Figure chart courtesy of Trading View illustrates short – term support and resistance.
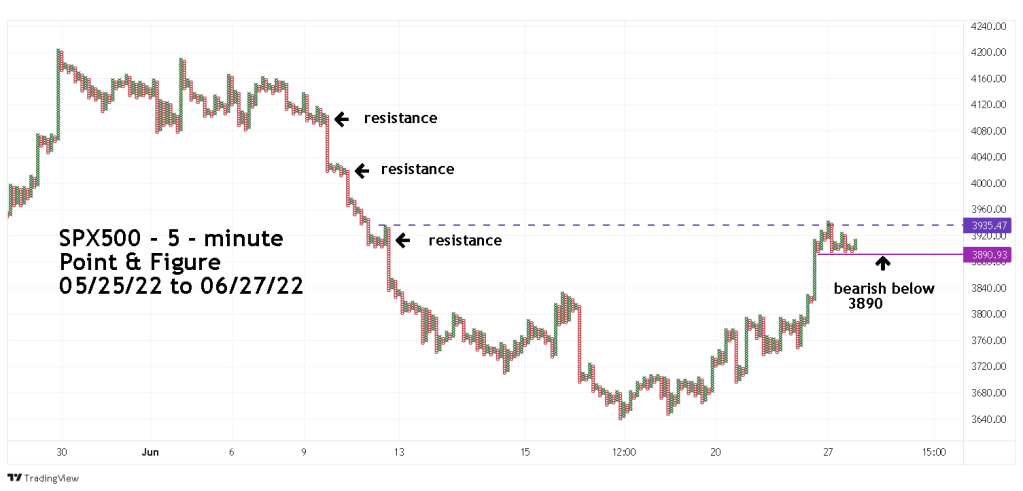
The SPX500 – Trading View symbol SPX500 shows action outside of the regular SPX trading hours and is a good index to discover intraday support/resistance.
In aftermarket regular trading SPX500 broke above short-term resistance then went into what appears to be a correction of the recent uptrend.
A break below SPX500 – 3,890 could open the door for a move down to at least 3,820. There’s moderate resistance at SPX500 – 4,020, stronger resistance is at 4,100.
The daily SPX chart illustrates more evidence.
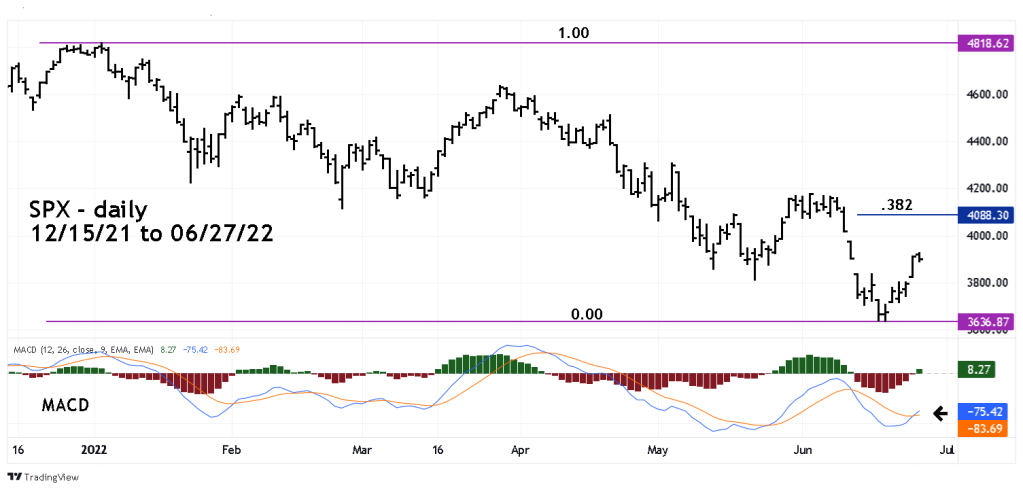
In addition to the daily MACD bullish lines crossover, the Histogram has crossed above the “zero” line.
A Fibonacci .382 retracement of the SPX January to June 2022 decline is at 4,088 close to the P&F cluster at 4,100.
The weekly SPX chart courtesy of BigCharts.com shows additional bullish signals.
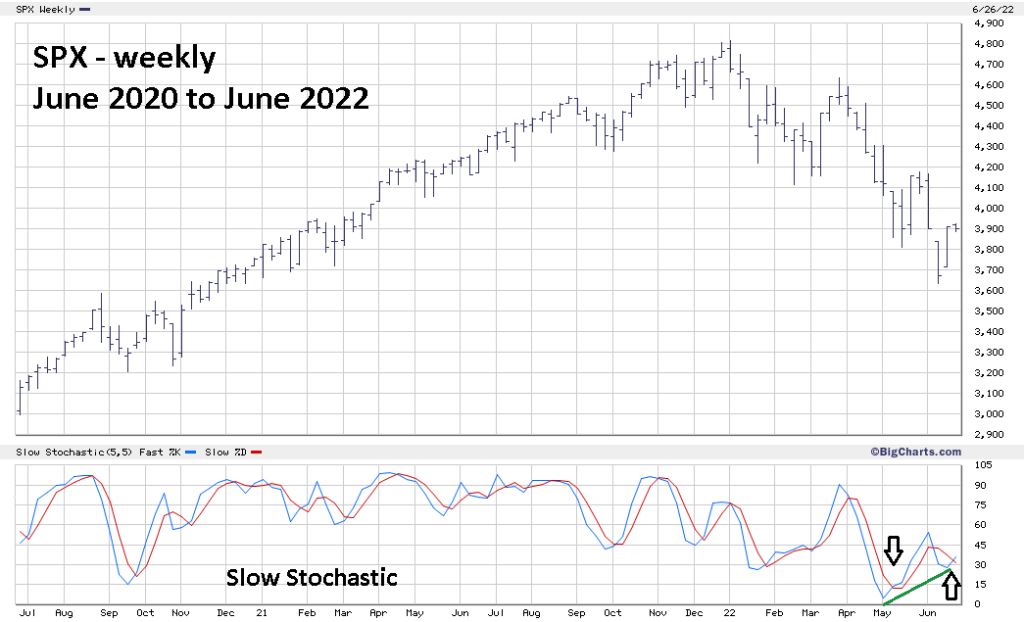
The weekly Slow Stochastic June 2022 bottom had a bullish divergence vs. the May 2022 bottom. Additionally, the Slow Stochastic had a bullish lines crossover. Note that after the prior bullish lines crossover the SPX had a two – week rally.
There’s a high probability the SPX could continue to rise for at least two – weeks into resistance near 4,100.
