For several weeks US stocks have been in a relentless decline. In the next few weeks could there be more downside action, perhaps 10, 15, or 20% lower? An examination of the Nasdaq Composite reveals some amazing data.
The Nasdaq Composite has dropped 31.9% from its all- time high. The S&P 500 has fallen 20.9% and the Dow Jones Industrial Average 17.1%. The Nasdaq Composite is leading the way down – let’s take a look at its long-term momentum.
The weekly Nasdaq Composite chart courtesy of BigCharts.com – symbol (COMP) illustrates the action during the prior five-years.

Weekly Slow Stochastic has reached the deepest oversold level since December 2018 with a bullish lines crossover. Note – COMP has been below the lower Bollinger band for two weeks. In December 2018 COMP was below the lower band for two weeks.
Weekly RSI has as of 05/20/22 has reached its lowest level since March 2020.
BigCharts.com has weekly COMP – MACD readings going all the way back to 1981. The MACD -lines reading made on 05/20/22 is the most oversold ever. Also note the Histogram bullish divergence. The next most oversold MACD – lines reading was made in April 2001 just before a one-month COMP rally.
The monthly COMP chart broadens the scope.
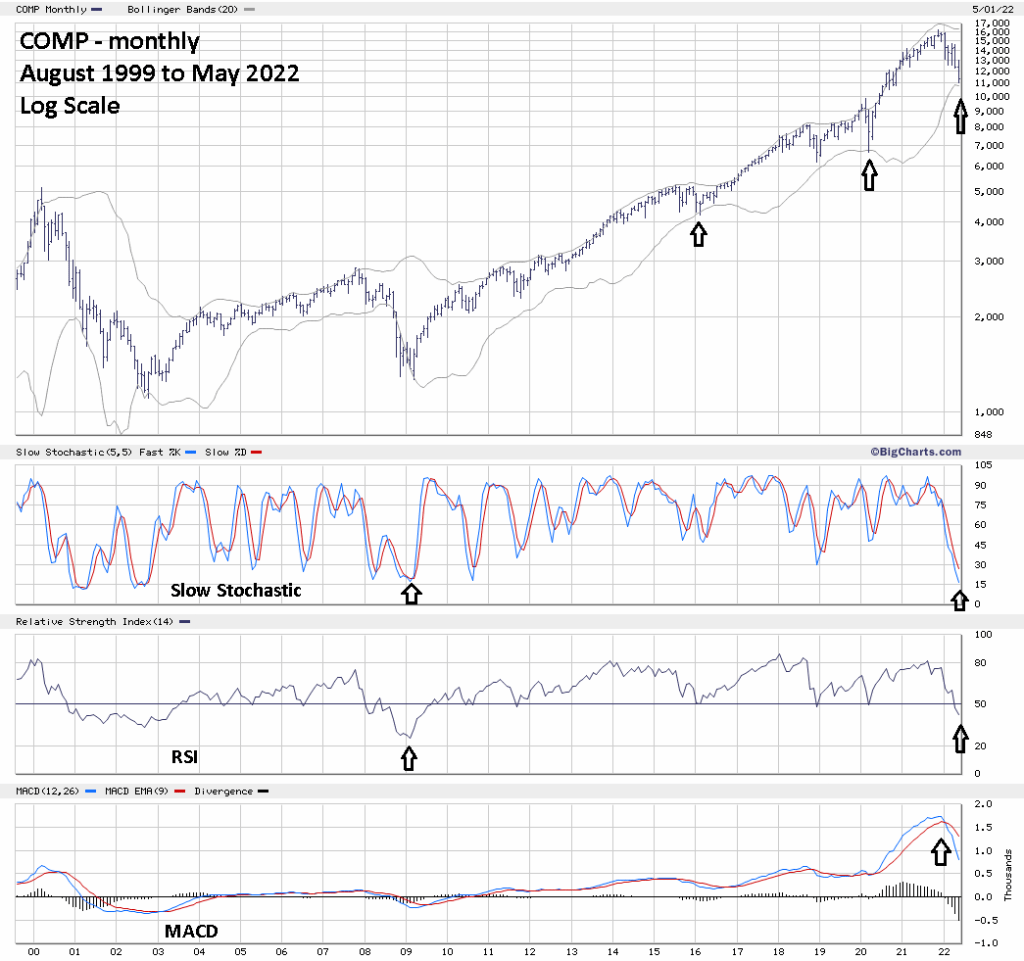
On 05/20/22 COMP was close to touching the lower monthly Bollinger band. The last two times the lower line was touched came in March 2020 and February 2016 – both were important bottoms.
Monthly Slow Stochastic is nearing the level reached in March of 2009 .
For the first time since the start of the secular bull market in March of 2009 the monthly RSI has decisively broken below the 50% line. This implies a bear market may have begun.
The monthly MACD has a bearish lines crossover suggesting at least a multi- month bear market is underway.
Bull markets don’t go up in a straight line and bear markets don’t go down in a straight line.
The monthly data suggests US stocks could be in a bear market.
Weekly data suggests that near term the bulk of the decline is behind us. Now is not the time to go short. The historically deep oversold readings imply an intermediate term bottom is near or could have been made on 05/20/22.
Traders were stopped out of half of a 100% long position on non-leveraged SPX related funds when the SPX went below 3825.00. The position was initiated on the SPX 05/13/22 open at 3963.90. the loss on half of the position was 1.75%. Continue holding the remaining half with a stop loss on an SPX move below 3795.00.
If the SPX 05/20/22 bottom holds and moves above 3963.90, there could be an opportunity to add on to the long position.
