The daily S&P 500 (SPX) chart courtesy of Trading View illustrates considerable bullish evidence.
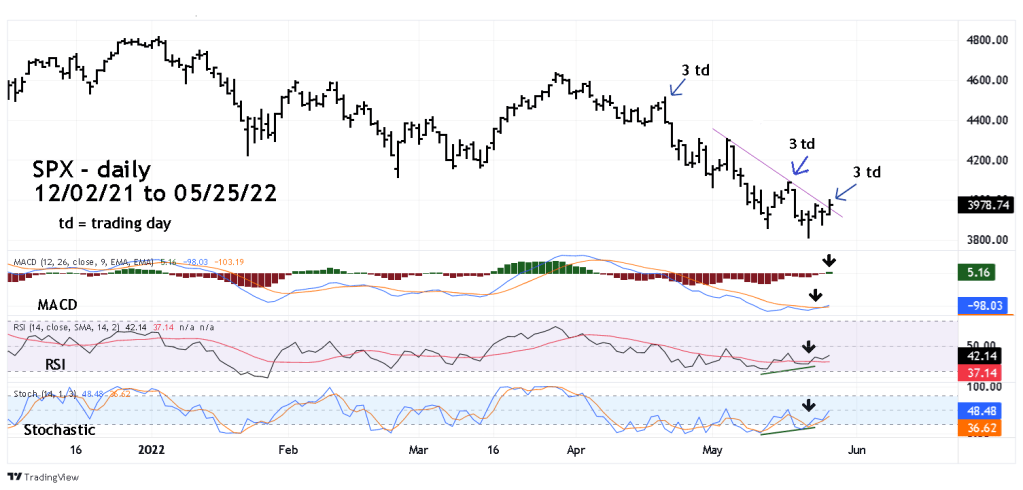
The SPX has broken above a declining daily trend line.
Daily MACD – Histogram has crossed the zero line.
MACD lines have a bullish crossover.
Daily RSI and Stochastics have bullish lines crossovers after having bullish divergences.
On the bearish side of the coin, after the prior two – three -day rallies, bears launched vicious attacks.
Could the bears begin a new drop that wipes out the recent rally? We may have the answer in a few trading days.
Traders are holding 50% long positions on non-leveraged SPX funds. Continue holding long with a stop loss on a move below SPX 3795.00.
