The 05/13/22 blog “Momentum Indicator Review – 05/13/22” noted that
“Since the S&P 500 (SPX) 03/29/22 top the rallies have not lasted longer than three- trading days.”
For three full trading days after the 05/12/22 bottom, US stocks indices had powerful rallies. Then 05/18/22, right on cue the bears initiated a vicious counterattack.
The Nasdaq Composite (IXIC) chart courtesy of Trading View illustrates the action.
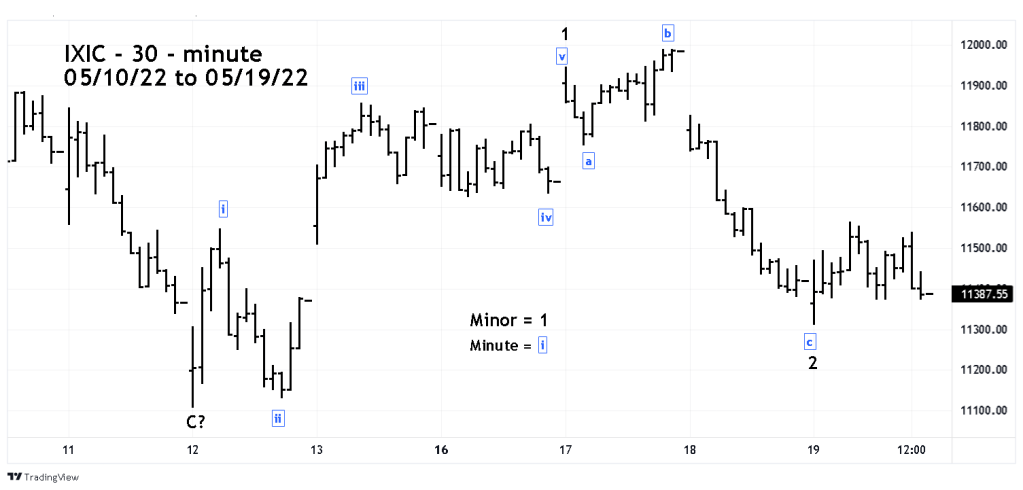
IXIC has a five-wave Elliott impulse pattern up from the 05/12/22 bottom followed by an Expanding Flat correction. The supposed Minute wave “b” – boxed has a Fibonacci relationship of 1.236 to Minute wave “a” – a typical ratio within Expanding Flats. Minute wave “c” is almost 3.618 the length of Minute wave “a.”
The Dow Jones Industrial Average was the only one of the three main US stock indices to go below its 05/12/22 bottom – a bullish “rule of the majority” signal.
Traders are 100% long non-leveraged SPX funds from the SPX 05/13/22 open. Continue holding long, keep the stop for half of the position on an SPX move below 3825. Use a move below SPX 3795 as a stop loss on the other half of the position.
