The 05/12/22 blog “ Nasdaq is Extremely Oversold” illustrated the weekly Nasdaq Composite – Slow Stochastic.
The weekly Nasdaq Composite chart (COMP) courtesy of BigCharts.com updates the action.

Weekly Slow Stochastic now has a bullish lines crossover in the oversold zone. Additionally, COMP went deeply below the lower Bollinger band and has moved back above the band. These two signals imply COMP could have at least a two-week rally.
When momentum indicators make lows that correspond with new price lows it implies the down trend at some point could continue.
The daily Nasdaq 100 – Bullish Percent Index ($BPNDX) courtesy of StockCharts.com updates the action of this momentum indicator .

The bullish $BPNDX divergences illustrated in prior web site blogs have been eliminated. $BPNDX momentum confirms the Nasdaq price low made on 05/12/22. The S&P 500 – Bullish Percent Index $BPSPX confirms the S&P 500 (SPX) low made on 05/12/22.
The daily Nasdaq new – 52 – week lows chart $NALOW updates the status of Nasdaq new lows.
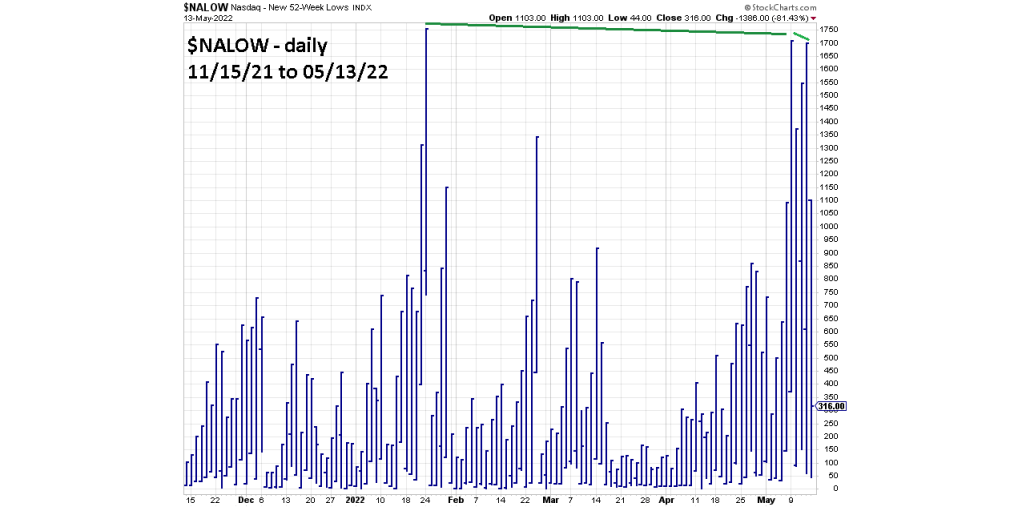
On 05/09/22 $NALOW had a marginal bullish divergence vs. the Nasdaq Composite 01/14/22 bottom. On 05/12/22 there was a short-term bullish divergence vs. the 05/09/22 Nasdaq Composite bottom.
On 05/12/22 NYSE new – 52 – week lows $NYLOW had eliminated all prior bullish divergences.
The daily VIX/SPX chart courtesy of Trading View updates this sentiment indicator.
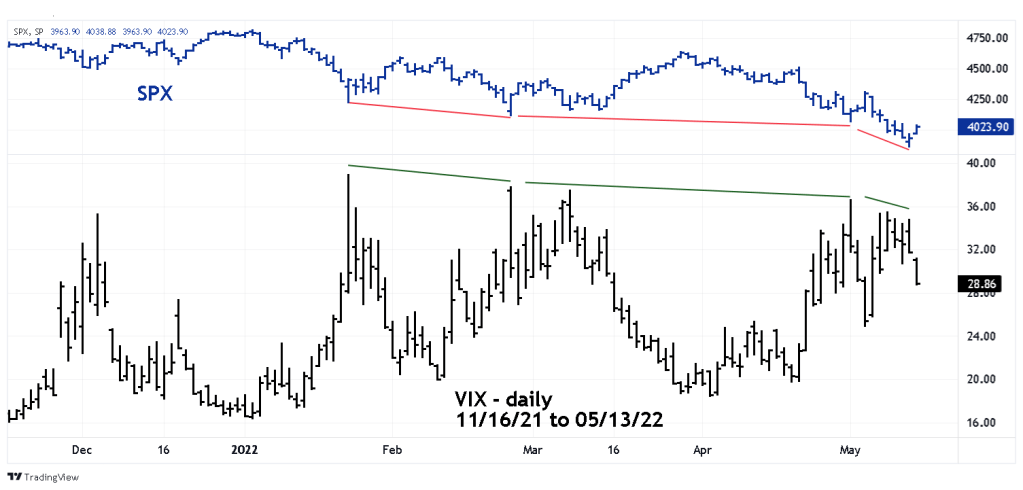
Frequently large VIX up spikes correspond to important lows for the (SPX). Occasionally the SPX makes a lower bottoms that correspond with lower VIX tops – a bullish sentiment divergence. A classic example of this phenomenon occurred in March 2020. On 03/18/20 the VIX reached its maximum high point. On 03/23/22 the VIX made a lower top while the SPX was making its ultimate bottom.
Normally there’s only one VIX divergent top. So far in 2022 there have been three bullish divergences, this is uncharacteristic and suspicious. There’s a good chance for a multi-week SPX rally, but the triple VIX bullish divergence may not be a super bullish divergence implying a new SPX all-time high.
When momentum indicators for markets invalidate bearish/bullish divergences it’s a hint of the main trend. The weight of evidence from the Bullish Percent Indices, and new – 52 – week lows confirm the bottoms made on 05/12/22. For US stocks the main trend could be down. It’s possible the SPX and or the Dow Jones Industrial Average could retrace close 90% of their respective 2022 declines. If the move up that began on 05/12/22 can continue until 05/20/22, this scenario will be examined in a future blog.
Since the SPX 03/29/22 top the rallies have not lasted longer than three- trading days. If the SPX is making new post 05/12/22 rally highs after 05/17/22 it increases the chances for a multi-week rally.
