Comparing US stocks as represented by the S&P 500 (SPX) with three other major national stock indices reveals fascinating clues of what could soon happen.
The 2022 stock market decline viewed on an international scale shows that since late March the SPX has underperformed Japan’s Nikkei 225 (NI225), Germany’s – German Stock Index – Dax (DEU40), and the United Kingdom’s UK 100 Index (UKX).
The daily NI225 chart courtesy of Trading View shows that index’s relative performance to the SPX.
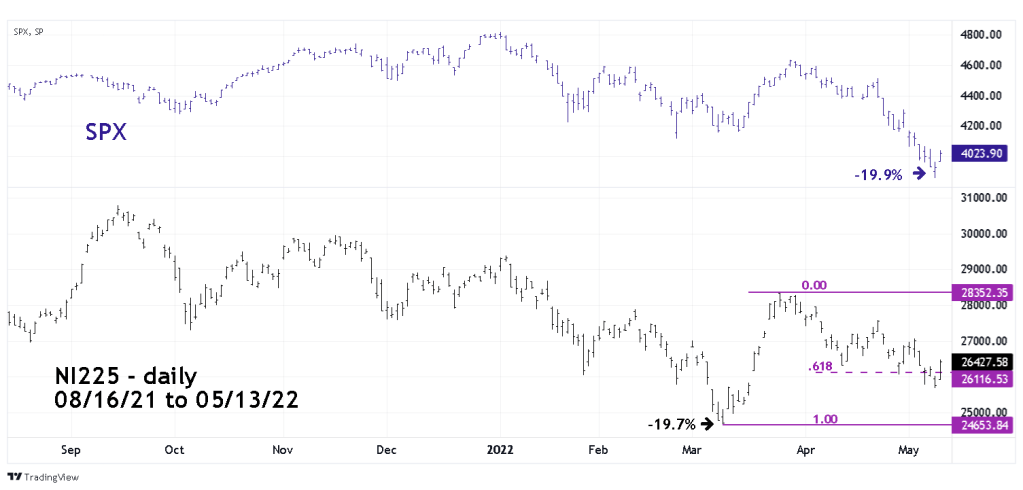
The NI225 made its post March 2020 rally high on 09/14/21, subsequently its drop has nearly matched the SPX decline of 19.9%. However, NI225 bottomed on 03/09/22.
The easiest way to describe Elliott Wave Theory is, straight lines followed by crooked lines. Now note the NI225 rally from 03/09/22 to 03/25/22 – almost straight up. The subsequent decline into the secondary bottom on 05/12/22 is choppy and looks like an Elliott wave Double Zigzag corrective pattern. The bottom on 05/12/22 exceeded a Fibonacci .618 retrace of the prior rally.
The daily DEU40 chart also shows near-term relative strength vs. the SPX.

DEU40 made a bottom on 03/07/22 and rallied into a high on 03/29/22 the same day as the SPX short-term top. Note the shallow angle of the DEU40 decline after 03/29/22 which is characteristic of corrective patterns. The decline ended on 05/09/22 three -trading days prior to the SPX bottom and at an exact Fibonacci .618 retrace of the 03/07/22 to 03/29/22 rally.
Also, daily MACD has a bullish lines crossover, and the Histogram has gone above the – zero line.
In Elliott wave terms the action since the DEU40 – 03/07/22 bottom appears to be an impulse wave up, then a corrective pattern, with the move up from 05/09/22 as a possible impulse wave that could reach at least the high made on 03/29/22.
The daily chart of UKX is the most fascinating.
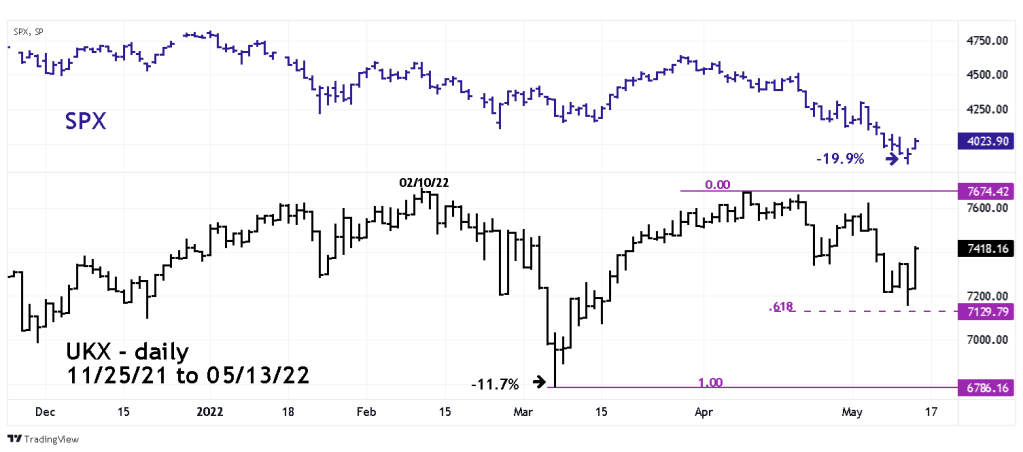
The UKX made its all-time high on 01/17/20. Long -term it has underperformed the SPX by a wide margin. In 2022 UKX has been much more bullish than the SPX.
The UKX 2022 high was made 02/10/22 more than a month after the SPX and DEU40 early January 2022 tops. The subsequent decline into the 03/07/22 bottom was only 11.7% far less than the SPX 19.9% drop. The rally after 03/07/22 nearly retraced the entire prior drop and the next decline came short of a .618 retracement.
UKX is clearly the most bullish of the four major national stock indices and within the next few weeks has an incredibly good chance at making a new all-time high. The UKX 02/10/22 top was only marginally below its 01/17/20 all-time high.
The combined evidence from the four nationally stock indices indicate a high probability all could have rallies into at least early June 2022.

The UK stock market looks like as classic a double top as you will find. How well do stock indices perform after making a double top? My guess would be that new highs are rarely seen for periods of 6-9 months after a double top.
LikeLike
Thanks for the comment. We could have an answer in just a few weeks. If UKX has a weak rally or breaks below its recent low made on 05/12/22 its additional bearish evidence.
LikeLike