It’s possible that the S&P 500 (SPX) decline since the start of 2022 is the fourth Primary degree wave of a five – wave Elliott impulse pattern that began in March 2009. This theory was examined in the 02/27/22 blog “S&P 500 Long – Term Elliott Wave Count – 02-25-22”. The SPX April to June 2010 decline of 17.1% is the presumed Primary wave “2”. On 02/24/22 the SPX had decline 14.6% – tending towards equality with Primary wave “2”. Waves “two” and “four” within Elliott motive patterns typically have Fibonacci relations near or at equality. The 02/27/22 blog also noted that the presumed Primary wave “4” decline from 01/04/22 may drop further and get closer to the 17.1% decline.
The daily SPX chart courtesy of Trading View illustrates the progress of Primary waves “1” and “2”.
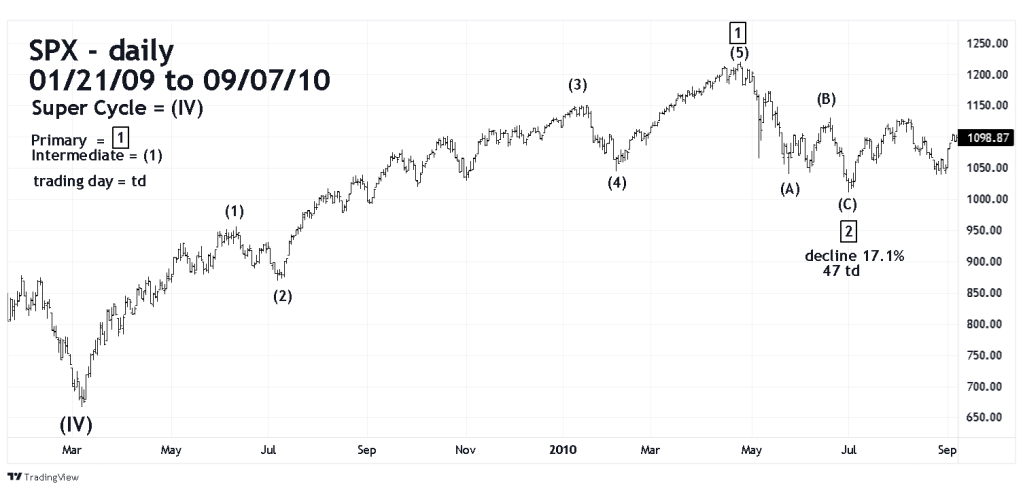
The April to June 2010 decline took 47 – trading days. The 03/15/22 blog “S&P 500 – Fibonacci Time Analysis – 03-15-22” examined a possible Fibonacci time relationship between the SPX 2010 decline and 2022 drop.
It appeared a bottom could form on 03/16/22 – 49 – trading days from the SPX 01/04/22 peak. As it turned out a bottom was made on 03/14/22 exactly 47 – trading days.
The daily SPX chart illustrates the Elliott wave count from 2020 to 2022.

A 17.1% drop from the all-time high at 4818.62 targets SPX 3994.64 as a potential Primary wave “4” bottom. A secondary Fibonacci coordinate comes from the SPX bottom made on 10/30/20 at 3233.94. A 50% retrace from that level to 4818.62 targets 4026.28, close to the primary coordinate of 3994.64. Allowing for leeway the broad target zone could be 4035 to 3985.
On 05/19/22 it will be 94 – trading days from the SPX top on 01/04/22. 47- trading days multiplied by two equals 94 – trading days or 47/94 = .50.
Allowing for leeway on time its possible the Fibonacci time target for Primary wave “4” could come before 05/19/22.
For example, 05/13/22 is 90 – trading days from 01/04/22.
The time ratio for Primary wave “2” to Primary wave “4” on 05/13/22 is 47/90 = .522.
Time ratio for 05/12/22 is 47/89 = .528.
Time ratio for 05/11/22 is 47/88 = .534.
The SPX 15 – minute chart illustrates why a bottom could occur in the 05/11/22 to 05/13/22 time frame.
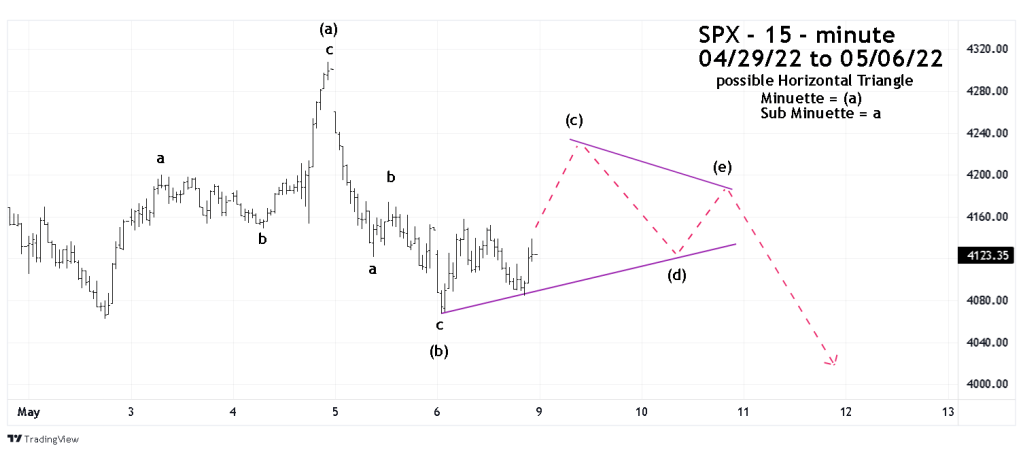
The 05/05/22 blog “Whipsaw Action” illustrated on a 15 – minute chart that the move up from the 05/02/22 bottom was a three-wave rally. The subsequent decline after that rally appears to also be a three-wave formation. Elliott wave – Horizontal Triangles are composed of five sub waves, each of which are three -wave formations. Perhaps an Elliott wave – Horizonal Triangle is forming? If so it may take one or two trading days to complete the pattern, followed by a sharp drop taking the SPX below the 05/02/22 bottom.
If the SPX reaches the 4035 to 3985 price zone sometime in the 05/11/22 to 05/13/22 time frame an important bottom could be made.
