The Nasdaq Composite (IXIC) made its all-time high in November 2021 more than a month before the other two main US stock indices, S&P 500 (SPX) and Dow Jones Industrial Average (DJI). Since then, it has been the weakest index – down 26% from its November 2021 top.
The 05/02/22 blog “US Stock Market Momentum and Sentiment – Part – Two – 05-02-02” noted that the bears were losing power and examined the IXIC momentum. The Nasdaq New – 52 – Week Lows ($NALOW) and Nasdaq 100 – Bullish Percent Index ($BPNDX), both had significant bullish divergences. On 05/06/22 the bears appear to have gained power.
The daily IXIC chart courtesy of Trading View illustrates important bottoms made since November 2021.
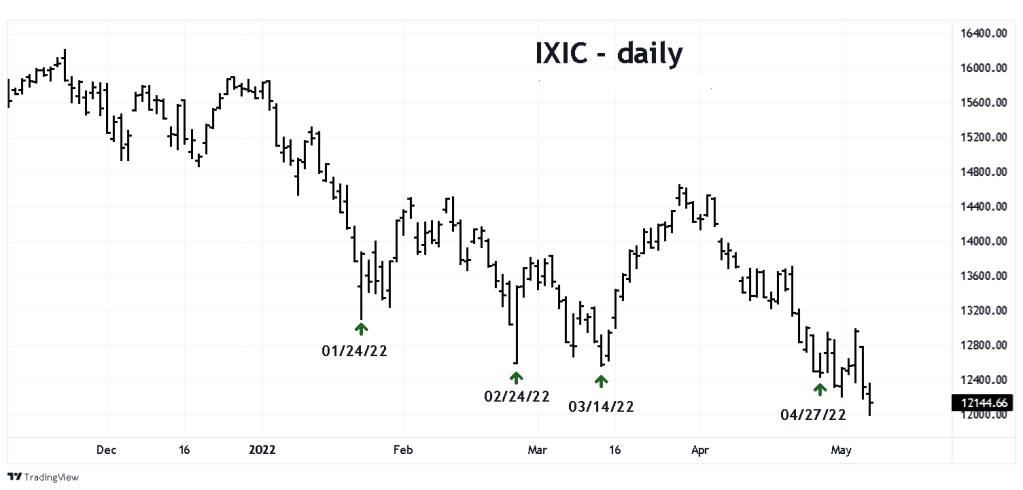
The key IXIC bottoms were made on 01/24/22, 02/24/22, 03/14/22 , and 04/27/22.
The daily ($NALOW) chart courtesy of StockCharts.com illustrates the new lows made at the key bottoms.

Maximum bearish momentum was made at the 01/24/22 bottom. The 03/14/22 bottom had a double bullish divergence. On 05/06/22 something different happened. Not only did $NALOW go above the level recorded on 04/27/22 it also exceeded the reading made on 03/14/22. This implies the IXIC could continue to make new decline lows.
The daily $BPNDX chart updates the action of this indicator.
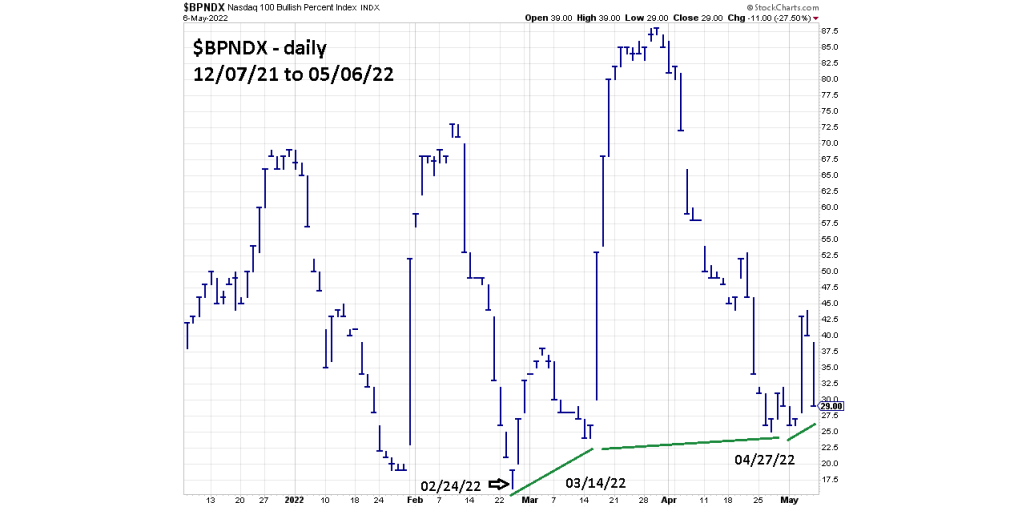
The Bullish Percent Index is a breadth indicator based on the number of stocks on Point & Figure buy signals within an index.
As of 05/06/22 the $BPNDX is still above its 04/27/22 reading and does not confirm the increase in bearish strength recorded by $NALOW. If this non-confirmation continues it could mean only marginal new IXIC lows. Perhaps one or two percent below the IXIC – 05/06/22 bottom.
The next blog will examine a fascinating web of Fibonacci price and time relationships within the SPX.
