On 04/28/22 it was announced that the first quarter US – GDP decreased. US stocks had a big rally on this bearish news. The next trading day US stocks had a big decline wiping out the prior day rally.
On 05/04/22 the FOMC announced an interest rate increase. US stocks had a big rally on this bearish news. Today US stocks had a big decline wiping out the prior day rally.
When individual stocks or any market moves contrary to an important news announcement its usually a very reliable signal of a trend change.
No market or stock signal is reliable 100% of the time. What’s happened on 04/29/22 and 05/05/22 are low probability events. Low probability does not mean no probability and traders need to be prepared for any scenario.
The 15 – minute – S&P 500 (SPX) chart courtesy of Trading View illustrates a possible Elliott wave count.
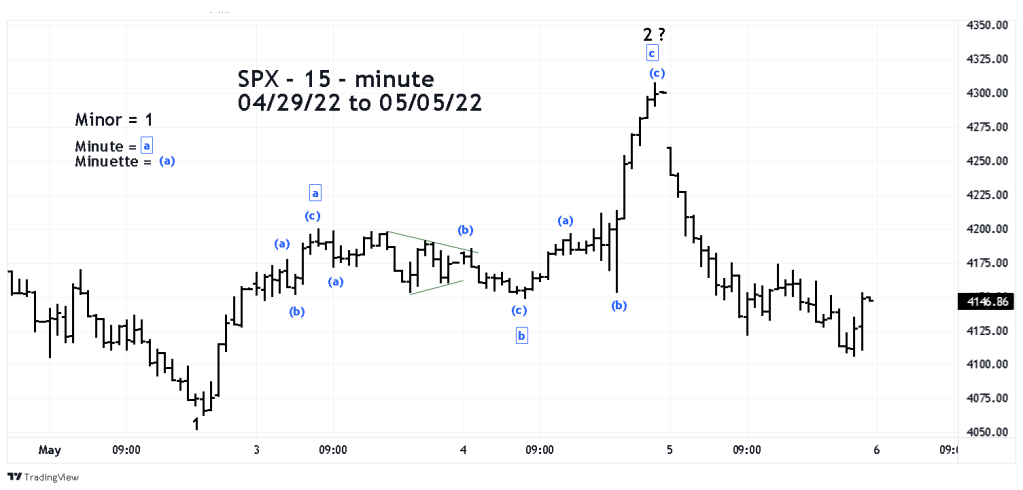
So far the rally from the 05/02/22 bottom has taken the form of a three- wave corrective pattern. If this count is correct it implies the SPX could soon move below the 05/02/22 bottom. If this happens it could trigger a two week move down to the SPX 3300 to 3400 range.
Arguing against this happening are the internal momentum indicators. Today the Nasdaq Composite was the only of the three main US stock indices to make a new 2022 decline low. Both the Nasdaq – New -52 – week lows and Nasdaq 100 – Bullish Percent Index continue to have bullish divergences.
Traders were stopped out of a 100% long position on SPX non-leveraged funds when the SPX went below 4153.47 and later 4127.73. the loss was 3.03%.
The next blog will update action on the momentum and sentiment indicators.
