The 04/12/22 blog “S&P 500 Decline is Losing Momentum” illustrated that the S&P 500 (SPX) 30 – minute MACD and RSI indicators were showing bullish divergences. On 04/14/22 internal momentum indicators were also showing bullish divergences.
The daily NYSE – Advance – Decline Issues ($NYAD) courtesy of StockCharts.com illustrates the NYSE Advance/Decline line.
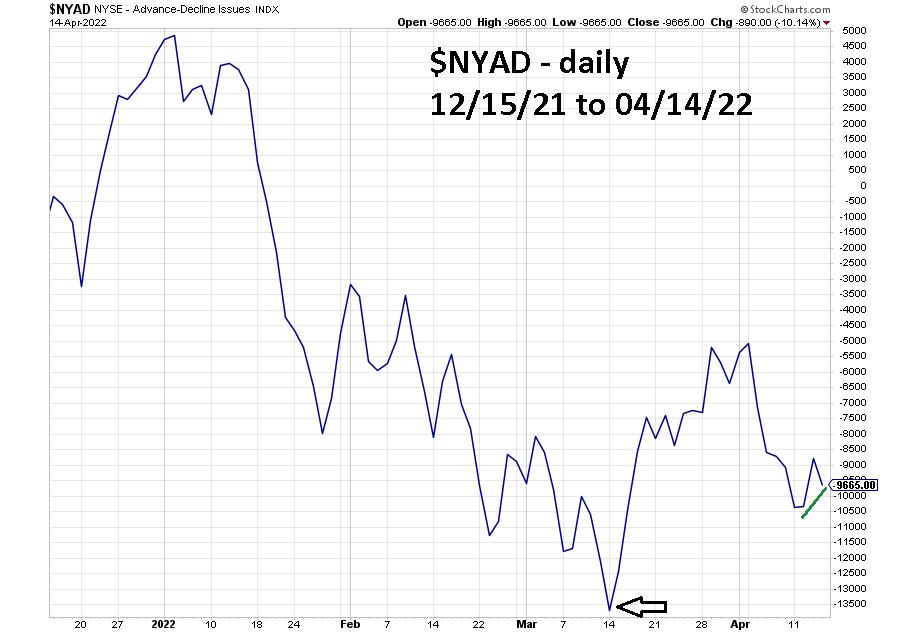
On 04/11/22 the SPX closed the session at 4412.54. On 04/14/22 the SPX closed the session at 4392.60, a lower price level yet the $NYAD ended the session above its 04/11/22 level.
Also note the $NYAD bottom was on 03/14/22, the same day as the presume SPX – Elliott wave – Horizonal Triangle termination point.
The daily NYSE – 52 – week Hi-Lo chart ($MADN) courtesy of Barchart.com illustrates NYSE stocks at 52 -week highs minus 52 – week lows.
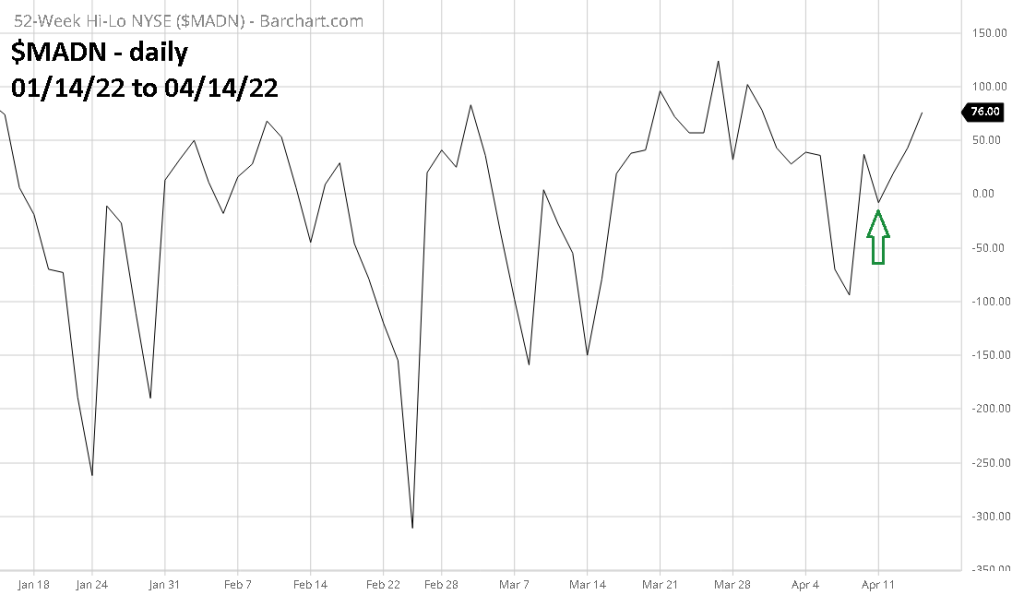
Again, the reading on 04/14/22 shows a bullish divergence vs. 04/11/22.
The bullish signals from $NYAD and $MADN are additional evidence that US stocks could be forming a short-term bottom.
The next blog will examine a potential signal from the Time dimension.
