The chart courtesy of Trading View illustrates the yields on the 30- year US Government Treasury bonds (TYX), the 10 – year US Government Treasury notes (TNX), and the 5 – year US Government Treasury Notes (FVX). Trading View illustrates the current FVX yield as 27.56, I’ve modified the chart to show the yield at 2.756.

There’s a bull market in yields that could soon exceed the peaks made in late 2018. Also note that the FVX 5-year yield is 2.756%, higher than the TNX 10- year yield of 2.712 and the TYX 30- year yield of 2.745. When shorter term yields are higher than longer term yields it’s called an inversion of the yield curve. Inversions are a signal of a coming economic contraction. The last time an inversion occurred was in 2006, one year before a major peak in the US stock market. In the current cycle US stocks could peak sooner than one year after an inversion signal.
The 04/09/22 blog noted that rising yields could cause stock fund managers to allocate some money into short-term US Government notes. This is just one factor that could trigger a significant decline in US stock prices. The other factor is the context in which yields are rising, and the context is what happened because of the Coronavirus panic.
March 2020 panic caused the FOMC to lower the 90- day rate/yield to zero , this made it much easier to borrow money to buy stocks. With severely depressed stock prices its not surprising that a powerful stock bull market resulted from the lowering of rates.
The stock bull market since March 2020 was based primarily on low bond/note yields and easing liquidity. The US economic fundamentals in April 2022 are still not at the level prior to March 2020 yet US stock price are far above the level reached in early February 2020.
The low yields and easy liquidity was heaven for stock bulls. Rising yields and tightening liquidity could be hell.
In Elliott wave analysis there are always alternate wave counts, you need to be prepared in case the prime wave count does not develop. Recent blogs have focused on the S&P 500 making a new all-time high. What if something else is developing?
The daily SPX chart illustrates a low probability alternate bearish Elliott wave count.
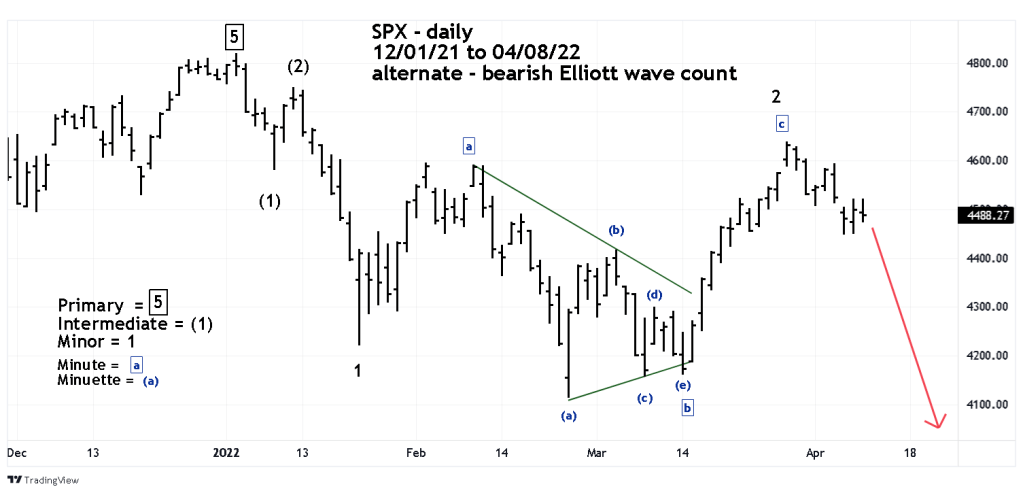
This is a low probability count because the presume Minor wave “2” is much larger than the higher degree presumed Intermediate wave (2). Also, internal and external momentum was bullish at the SPX 03/29/22 top. Low probability does not mean no probability, if the SPX breaks below its recent trading range bottom at 4450 it could be a decline of a few days or something bigger.
The current condition for US stocks is mixed. Seasonal patterns are bullish until late April, yet rising yields are a looming threat for the stock bull market.
We could have a clearer picture of the main trend after the SPX breaks out of the trading range between 4450 and 4521.
