On a daily chart the S&P 500 (SPX) move up from the 03/14/22 bottom was fast and steep. The reason is because shortly after a significant bottom has been recognized , traders are eager to establish long positions. The SPX move off of the 03/23/2020 bottom is a classic example of a move up after a significant bottom Some traders may hope for a sharp and deep correction, but markets are notorious in dashing the hopes of traders.
The SPX – one minute Point & Figure (P & F) chart courtesy of Trading View illustrates some potential support zone.
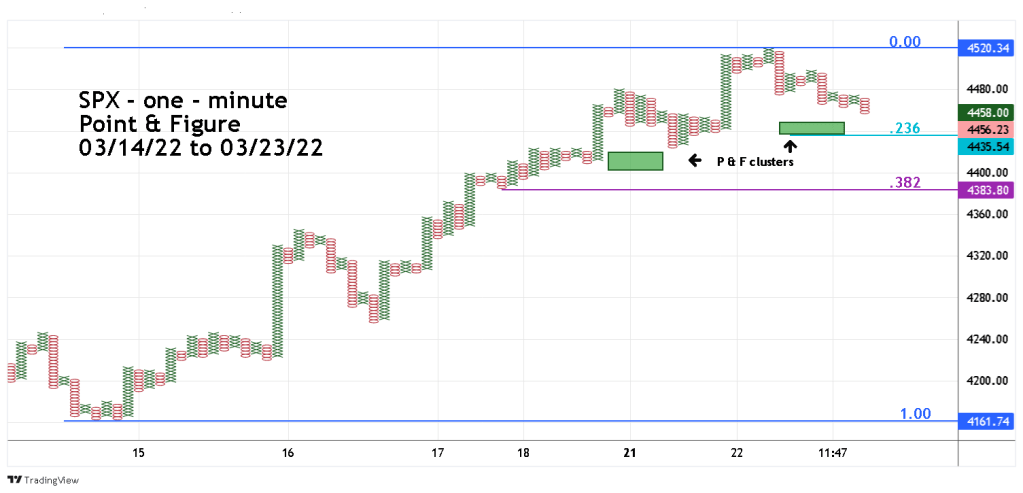
The P & F chart combined with Fibonacci analysis helps to identify the areas for the next possible bottom. The first is P & F cluster. The lower boundary of the cluster is at the Fibonacci .236 retracement level of the move up from the 03/14/22 bottom.
If the first support level doesn’t hold, there’s another cluster in the low SPX 4400 area.
Below that cluster is the .382 retracement level which intersects with P & F chart support at 4383.80.
The 03/21/22 blog “S&P 500 – Fibonacci Time Connection Between 2010 and 2022” illustrated that on 03/14/22, the SPX had probably completed an Elliott wave – Horizontal Triangle. Usually after a Horizontal Triangle is complete there’s a sharp and fast move in the direction of the main trend, which in this case is up.
The action since the 03/14/22 bottom is exactly what’s expected after the end of a Horizontal Triangle. Seasonal patterns for US stocks are bullish until late April/early May. These factors imply the steep rally could continue until late April.
A shallow correction bottom could be made soon, perhaps in just one or two trading days.
