On 03/22/22 the S&P 500 (SPX) may have completed a short-term top.
The 15-minute SPX chart courtesy of Trading View illustrates the short -term Elliott wave count.
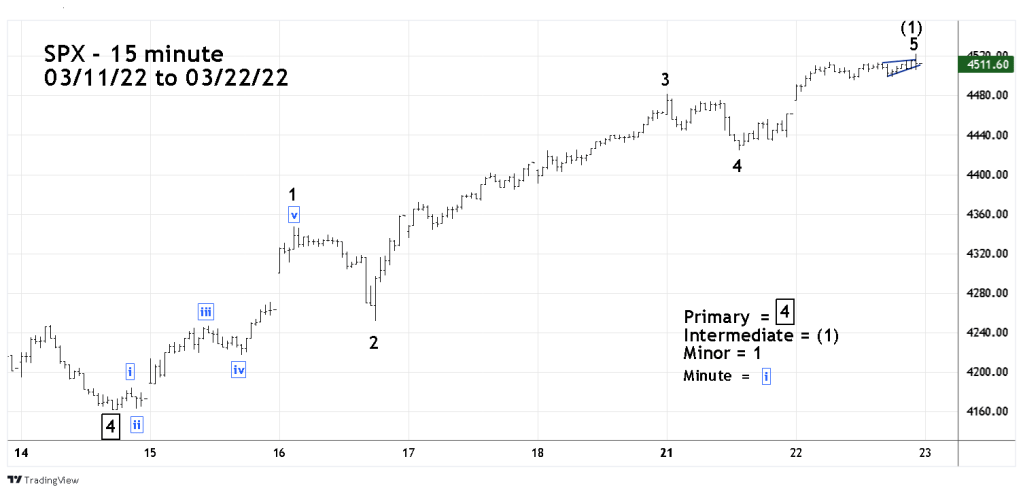
There’s a five – wave impulse pattern up from the presumed Primary wave “4” Horizontal Triangle termination point. Within the five-wave structure Minor wave “5” is close 50% of the length of Minor wave “1” which is a frequent Fibonacci relationship between waves “one” and “five”.
The 5 – minute SPX chart provides additional Elliott wave evidence.
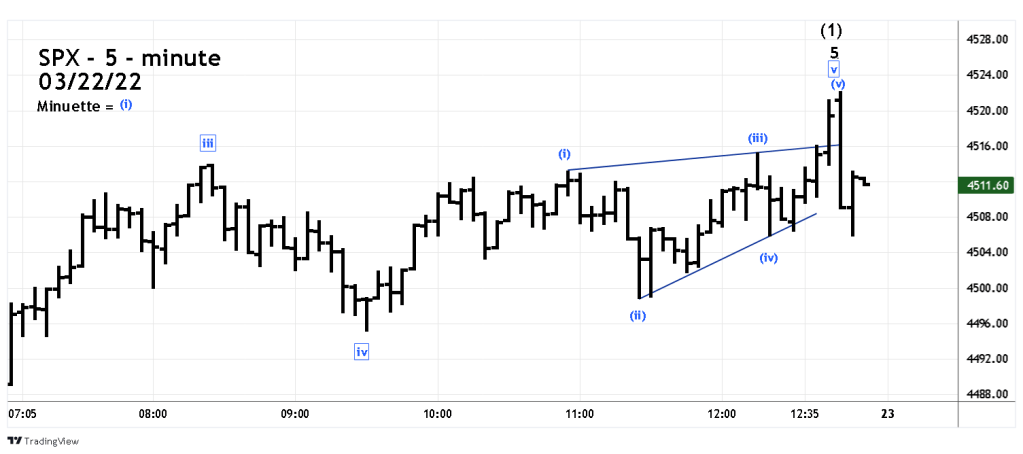
It appears that Minute wave “v” – boxed of Minor wave “5” has taken the form of an Elliott wave Ending Diagonal Triangle. This is a termination pattern and what you would expect after what R.N Elliott called “ a market that has moved too far too fast.”
If the pattern is correct the SPX 03/22/22 high should hold and there could be a multi – day correction of the rally off of the SPX 03/14/22 bottom.
If there is a short-term decline it could set up an opportunity for long positions.
