The 03/23/22 blog “Potential S&P 500 – Support Zones” noted that a shallow bottom could be made soon – perhaps in one or two trading days. As it turned out a bottom was already in place on 03/23/22 as the S&P 500 (SPX), the Nasdaq Composite and Dow Jones Industrial Average have subsequently made new post 02/24/22 rally highs.
The daily SPX chart courtesy of Trading View illustrates the progress of the rally.
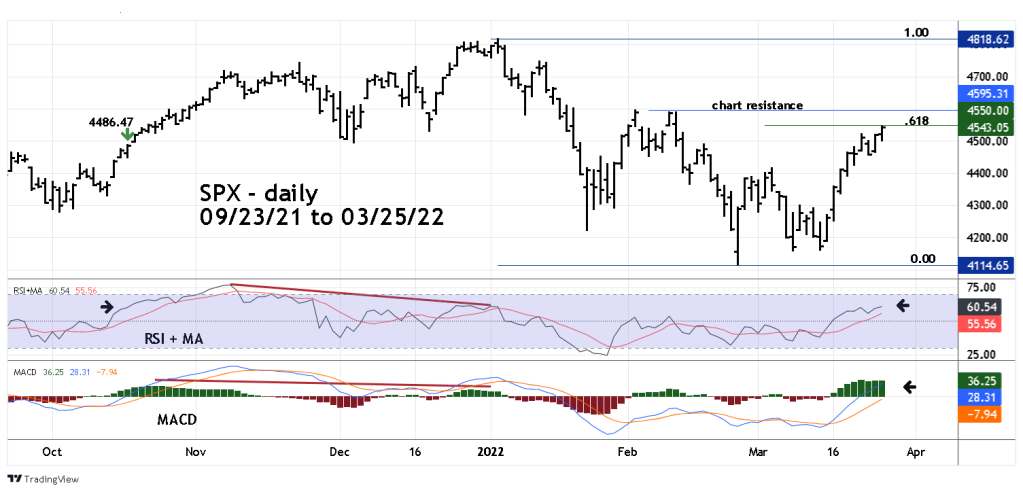
The SPX is nearing the Fibonacci .618 retracement level of the 01/04/22 to 02/24/22 decline. Just above that is chart resistance at 4595. It’s possible another short-term peak could be made in this resistance zone – however, stay focused on the bigger picture.
The daily RSI has still not reached the over bought zone. Additionally, stocks and stock indices usually need at least one bearish divergence before a significant price top is in place. Note the RSI action from October 2021 to January 2022. Also, the RSI current level is at approximately the same level as on 10/18/21 when the SPX closed at 4484.47. If the SPX can come near repeating what happen after October 2021 it could make a new all-time high.
Note the width of the MACD – Histogram. Generally, when above the – zero line its bullish. Note the bearish divergence at the SPX – January 2022 top. Think of the MACD – Histogram as a fuel gauge, and in this case there’s plenty of fuel for the rally to continue.
Summary.
Price Dimension: Bullish – Elliott wave patterns suggest post Horizontal Triangle thrust up is underway since 03/14/22.
Time Dimension: Bullish – US stocks are seasonally bullish until late April/early May.
Momentum Dimension: Bullish – Daily RSI and MACD imply more upside action.
There’s a high probability US stocks could continue a sharp and steep rally into at least late April. If so its likely to terrify the bears, and if the SPX can make a new all-time high many of them could miss possibly the best stock shorting opportunity since October 2007.
