The 03/15/22 blog “S&P500 – Fibonacci Time Analysis 03-15-22” noted that there could be a Fibonacci time relationship between the S&P 500 (SPX) presumed Primary wave “2” decline April to June 2010 with the SPX January to March 2022 Primary wave “4” decline. On 03/15/22 it looked like the SPX decline from 01/04/22 was an Elliott wave – Ending Diagonal Triangle. It now looks like a different type of triangle was forming.
The 30- minute SPX chart courtesy of Trading View updates the Elliott wave count.
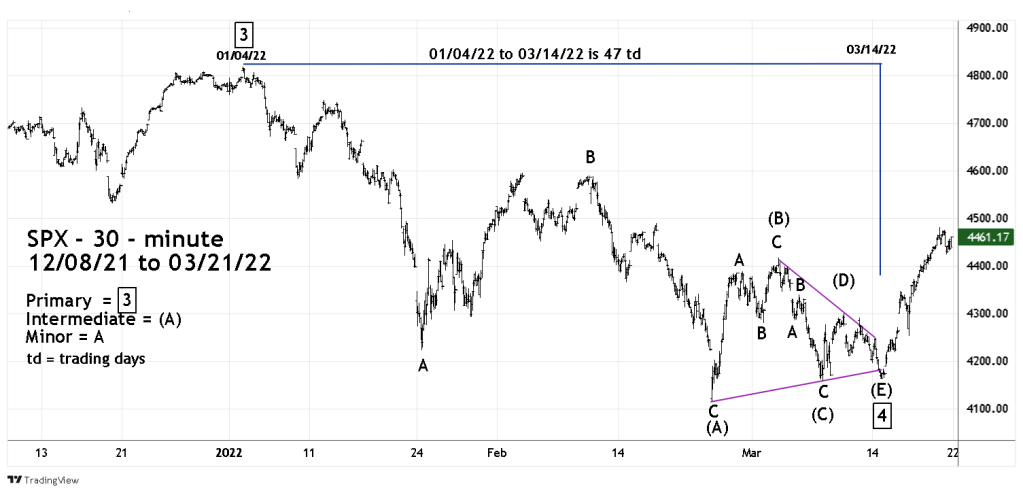
There’s a high probability that an Elliott wave – Horizontal Triangle ended on 03/14/22.
Horizontal Triangles are sideways corrective patterns that are composed of five sub waves in which each sub wave have three wave structures or a combination of three wave patterns.
Ending Diagonal Triangles are motive patterns that travel in the direction of the main trend. They are also composed of five sub waves in which each sub wave have three wave structures or a combination three wave patterns.
Because each triangle pattern have five sub waves composed with three wave structures, they are frequently the alternate wave count for each other. If you see what looks like a Horizontal Triangle it could an Ending Diagonal Triangle. Or the Ending Diagonal Triangle could be a Horizontal Triangle.
The most amazing factor about the movement from 01/04/22 to 03/14/22 is the number of trading days (td) it took to complete.
The daily SPX chart illustrating the 2010 decline is the same chart used in the 03/15/22 blog.

The SPX – 2010 Primary wave “2” traveled 47 td exactly the same as the presumed Primary wave “4”. Incredible!
Primary wave “2” was a Single Zigzag. Under the guidelines of alternation, you would expect wave “four” of the same degree to have a different corrective wave pattern. In this case it’s a Horizontal Triangle.
Additionally, Horizontal Triangles only appear in the fourth wave position of motive patterns.
Primary wave “2” declined 17.1%.
The widest part of the presumed Primary wave “4” decline was 14.6%.
The ratio of wave 4/2 is 14.6/17.1 = 85.3% which tends toward equality.
There’s a very high probability that a post Horizontal Triangle wave thrust up is under way from the 03/14/22 bottom and could reach its termination point by late April/early May 2022.
