The main characteristic of an Elliott wave – Ending Diagonal Triangle is it’s wedge shape between converging trendlines. The supposed S&P 500 (SPX) Ending Diagonal Triangle (EDT) from the 01/04/22 peak now has diverging trendlines.
The daily SPX chart courtesy of Trading View illustrates the recent action.
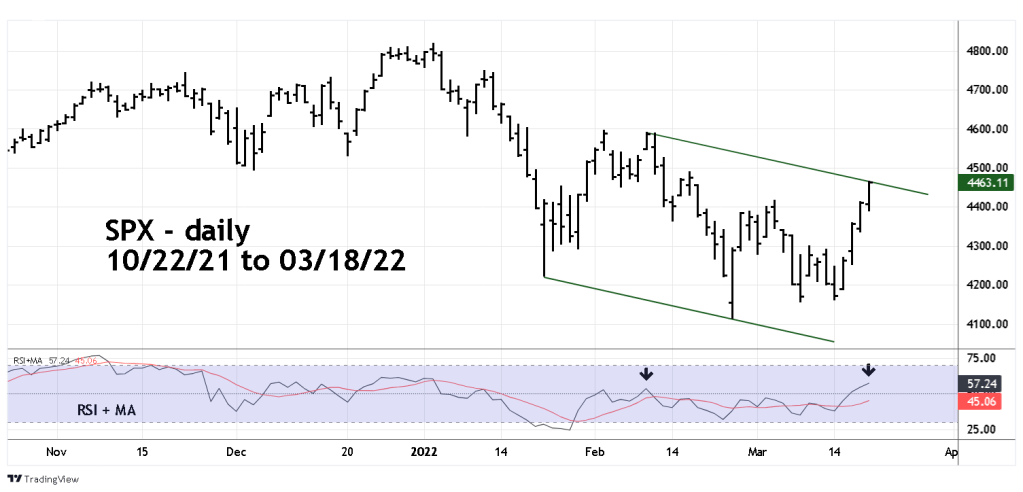
Could an Expanding – EDT be forming – which has diverging trendlines? Highly unlikely, this is a very rare formation. I’ve never seen an Expanding – EDT on a daily chart, and only once on a five – minute chart.
Short-term momentum is bullish. The daily RSI reading on 03/18/22 was 57.24, the reading at the higher SPX peak on 02/09/22 was 53.48. This is a bullish divergence and implies the SPX could soon reach at least the top made on 02/09/22.
The daily SPX – Bullish Percent Index ($BPSPX) courtesy of StockCharts.com updates the progress of this momentum indicator.
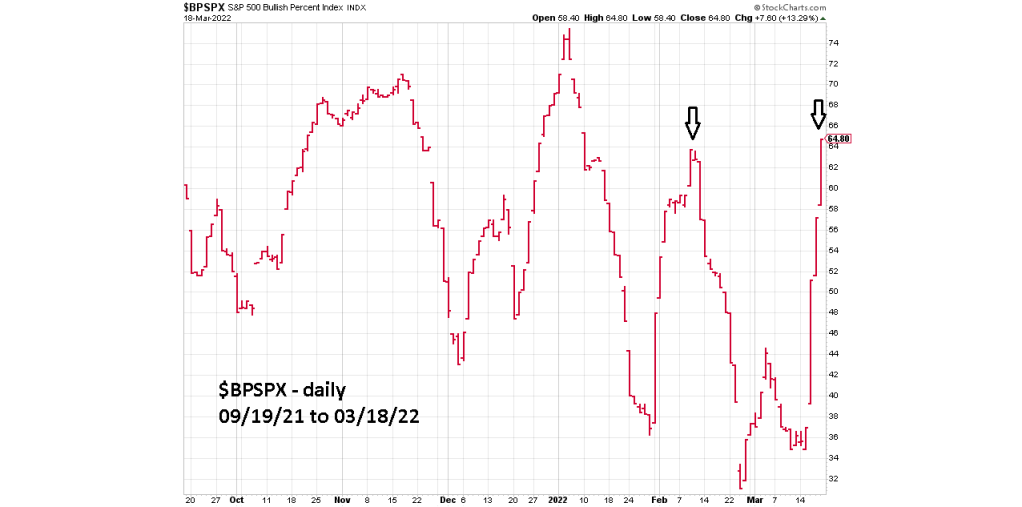
$BPSPX is now also above the level it recorded at the SPX 02/09/22 top, confirming bullish evidence from the daily SPX – RSI.
Seasonal patterns for US stocks are bullish until late April/early May. Combined with the bullish momentum signals, there’s a high probability the SPX could reach its all-time high by late April 2022. Possibly sooner.
