The 01/24/22 blog “Something Different is Happening” noted that the S&P 500 (SPX) January 2022 decline indicated a bear market may have begun. The vast majority of individual US stocks are probably in a bear market. What about the main US stock indices, could any of them still make a new all-time high?
The 02/02/22 blog “Bullish Crossover” noted that the SPX move above important resistance at 4582.24 increased the chance for a new SPX all-time high. What happened prior to the SPX October 2007 peak could give important clues for SPX action in February 2022.
The daily SPX chart courtesy of Trading View illustrates the topping action from July to October 2007.
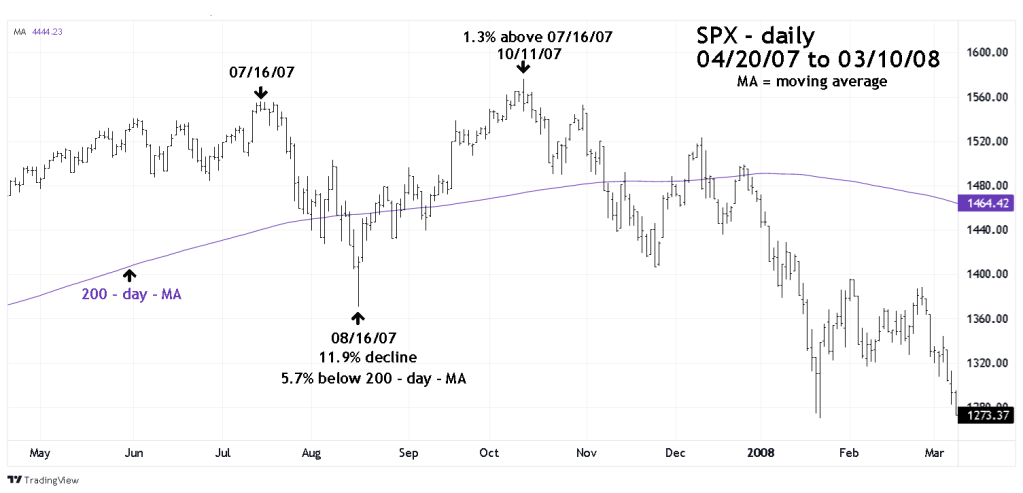
The July 2007 to August 2007 SPX drop was 11.9% close to the SPX January 2022 – 12.3% decline. In August 2007 the SPX went 5.7% below its 200 – day – moving average (MA). Close to the SPX January 2022 move of 4.6% below the 200 – day – MA.
The move down from 07/16/07 to 08/16/07 was 23 – trading days (TD). The subsequent rally from 08/17/07 to the then all-time high on 10/11/07 was 38 TD. The decline to rally ratio is 23/38 = .605 close to the Fibonacci Golden ratio of .618.
The SPX ultimate top in October 2007 was 1.3% above the penultimate peak in July 2007.
The next SPX chart illustrates the daily action from October 2021 to February 2022.
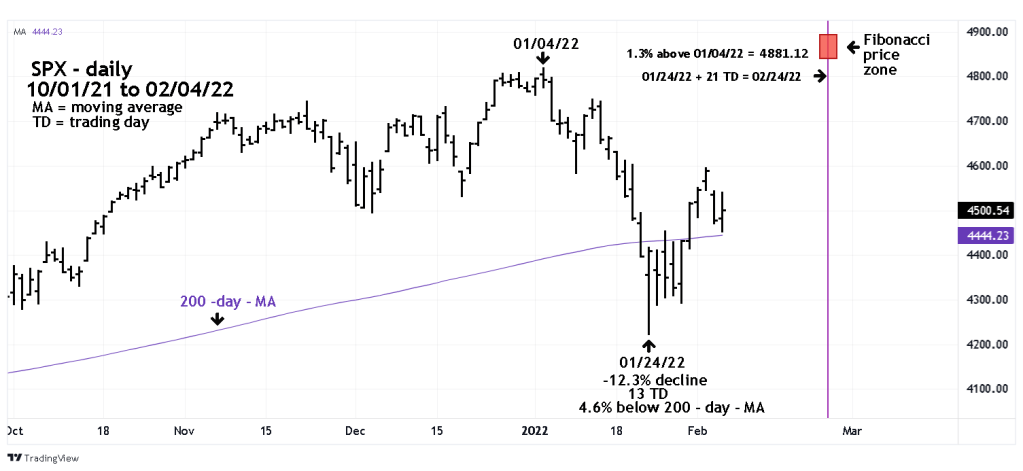
As noted the July 2007 to October 2007 decline to rally ratio was .605. The January 2022 decline was 13 – TD. Multiplying 13 TD by 1.618 equals 21 TD. Added to the 01/24/22 SPX bottom targets 02/24/22 as a potential top for a January to February SPX rally.
The 11/10/21 blog “Possible S&P 500 – Price Topping Zone” noted that SPX 4889 could be the bullseye price target for an ultimate price high, with a leeway zone of 4860 to 4890. Later blogs noted an expanded leeway of 4840 to 4890.
In October 2007 the SPX made a marginal new high of 1.3% above the July 2007 top. A 1.3% move above the SPX 01/04/22 high of 4818.62 targets 4881.12 close to the bullseye target of 4889.
An SPX rally to 4840 to 4890 during the week of 02/22/22 to 02/25/22 could be a fantastic shorting opportunity!

Hello Mark,
Before to go in rally to 4889, do you keep in target as in your previous blog “bullish crossover” to get another drop below the 01/24/22 bottom- with a bullish divergence?
Thank you in advance and thank you for your all analysis.
Christian (France)
LikeLike
It looks more likely that the SPX could continue moving to 4889 without making a move below the 1/24/22 bottom. While its a low probability, we can’t rule out a marginal break below the 4889 bottom. The main bullish factor for US stocks are seasonal patterns which are bullish until late April. Be prepared for any scenario.
LikeLiked by 1 person