Markets are perpetual battles between bulls and bears, each side testing support/resistance points and attempting breakthroughs.
The 30 – minute S&P 500 (SPX) chart courtesy of Trading View illustrates a recent battle.

On 02/09/22 and 02/10/22 the bulls attempted a breakthrough of the peak made on 02/02/22. Both attempts failed with the second trust up on 02/10/22 unable to break above the high made on 02/09/22. The bears then seized upon this failure and launched a powerful counterattack.
The thrust down has brought the SPX to a .618 retracement of the 01/28/22 to 02/02/22 rally, a logical spot where you would expect the bulls to defend.
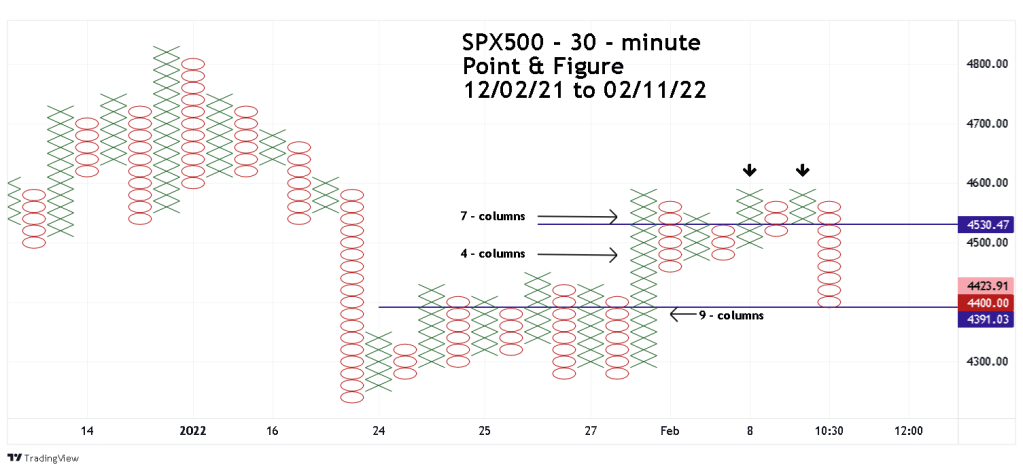
The 30 – minute SPX500 – Point & Figure (PF) chart provides clarity to the support/resistance points.
SPX500 is an index on tradingview.com the symbol is SPX500. This index shows the action of a perpetual S&P 500 E-Mini contract yet its priced similar to the SPX .
PF charts are highly effective in discovering support/resistance because they focuses only on price. X’s represent rallies, O’s illustrate declines.
The two failed rallies represent significant resistance. After the 02/10/22 peak the bears were able to breakthrough powerful support at 4530.47 which was the lower boundary of a seven – column row. The degree of strength is determined by the number of columns in a row. The row just below 4530.47 was also seven-columns – equal in strength and unable to stop the move down.
Below the second seven column row bullish barriers were progressively weaker. A five column then a four column, and finally a two-column row. The bears where able smash through these feeble defenses.
Near the end of the 02/11/22 SPX trading session prices had reached a major bullish support zone – the upper boundary of a nine-column row.
If the support holds the bulls could then mount a rally to attack the significant resistance at the 02/02/22, 02/09/22, and 02/10/22 triple peak.
If on 02/14/22, or in the next few trading days, the bears can punch through the powerful support zone, it could open the door for a move to at least the 01/24/22 bottom.
