Today 02/02/22 the S&P 500 (SPX) crossed above 4582.24, the bottom of the supposed Minute wave “i”. In a standard Elliott impulse wave the fourth wave can not cross into the territory of wave “one.” This crossover invalidates the standard impulse wave count and increases the chance of a new SPX all-time high.
The daily SPX chart courtesy of Trading View illustrates the recent action.
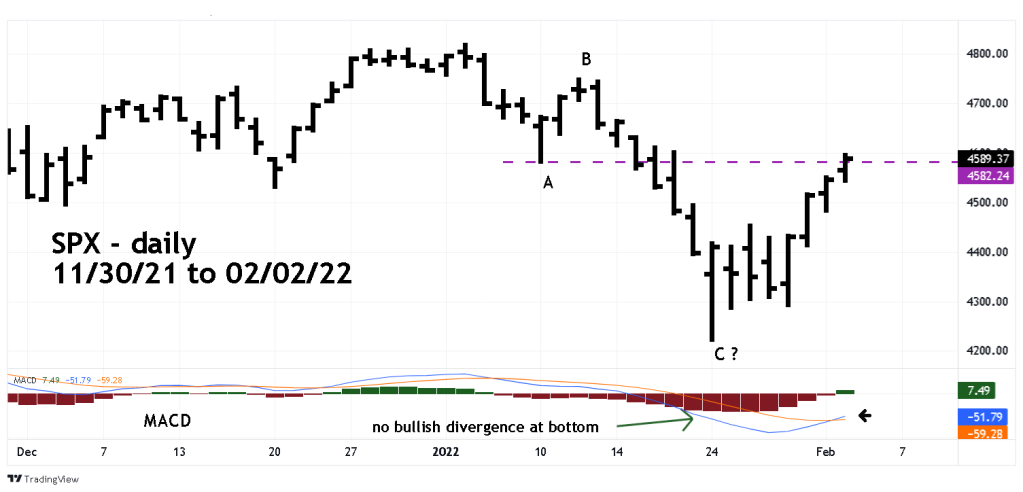
The message from the daily MACD is mixed. Today the lines had a bullish crossover. However, at the 01/24/22 bottom the Histogram and lines had no bullish divergence. This could mean before a new all-time high is made, there’s another drop below the 01/24/22 bottom- with a bullish divergence.
Short-term momentum is bullish implying higher SPX prices over the next few trading days.
Hold off on taking long or short positions.
Longer-term, the evidence implies a major top for US stocks is forming. If so, there could be several opportunities to establish short positions.
