Elliott wave “fours” in standard impulse waves are normally shallow usually retracing a Fibonacci .382 of the third wave, or .382 of the movement from the start of wave “one” to the end of wave “three”. The reason for shallow retracements is that at whatever time scale, a change of trend is perceived, and counter trend moves usually do not make much progress.
The 30- minute S&P 500 (SPX) chart courtesy of Trading View illustrates the recent action.
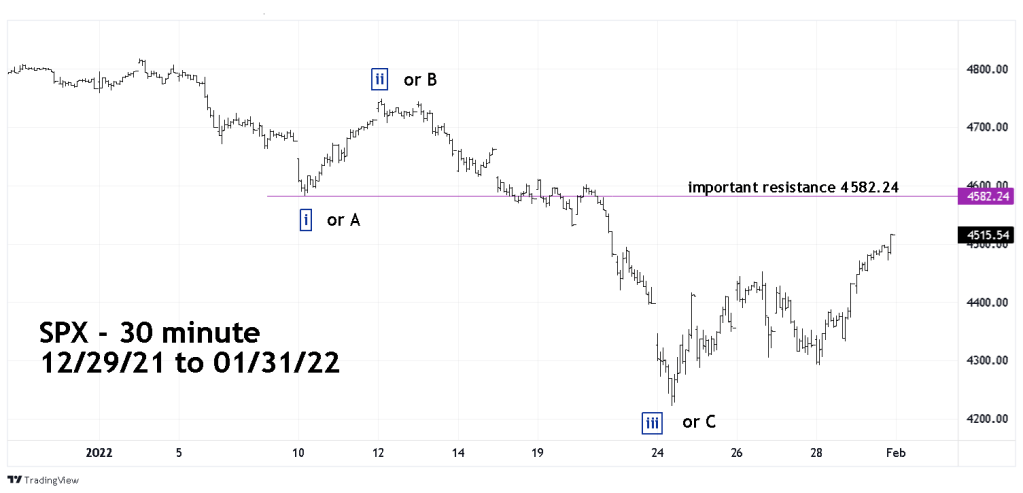
The move down from 01/04/22 to 01/24/22 was steep with only one significant counter trend move and appears at least in the short-term to be a trend change to the downside.
Prior blogs have noted that the 01/26/22 SPX high was just above a .382 of the drop from 01/04/22 – a logical place for the termination of the counter trend move.
The 01/30/22 blog noted that SPX 4500.00 could be resistance. This level was where the supposed minute wave “iv” would be 1.618 times the supposed minute wave “ii.” The bulls eye level is 4489.00 with an 11-point leeway.
Today 01/31/22 the SPX exceeded both the 01/26/22 high and the 4500.00 level.
The next important resistance is at 4582.24. In standard impulses waves the fourth wave cannot travel into the price area of wave “one.” The wave “one” bottom is 4582.24. If the SPX reaches this level it would imply that the drop from 01/04/22 to 01/24/22 was a correction within an ongoing bull market.
