If the S&P 500 (SPX) bottom of 4614.75 made on 01/14/22 holds, it represents an important cycle point.
The daily SPX chart courtesy of Trading View illustrates the best Elliott wave count.
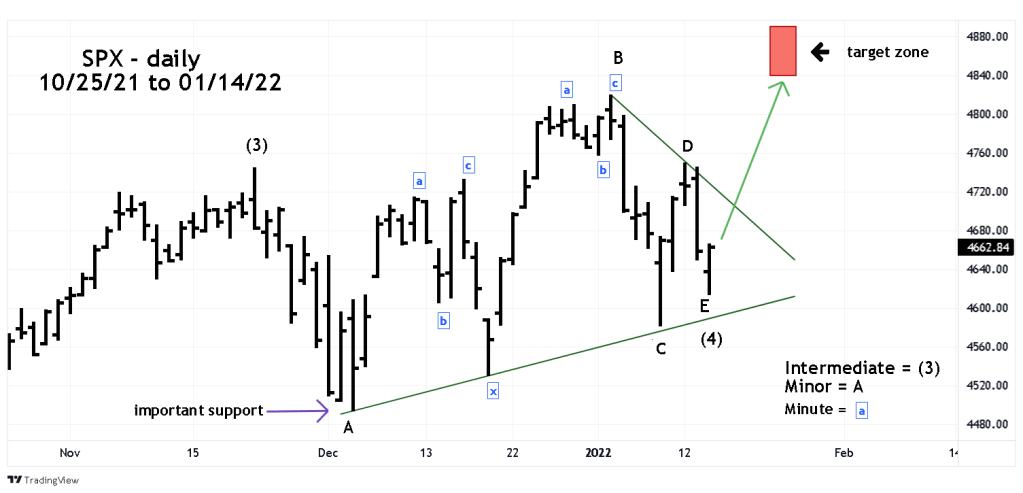
It appears an Elliot wave – Running Horizontal Triangle may have completed on 01/14/22. In Running Horizontal Triangles – wave “B” slightly exceeds the point of origin of wave “A.” The most likely Fibonacci ratio of wave “B” to “A” is 1.236. the next most likely ratio is 1.382. In this Running Horizontal Triangle, the ratio of “B” to “A” is 1.30.
The ratio of wave “A” to “C” is 1.05, near equality.
The ratio of wave “D” to “B” is .514, near .50.
After completion of Horizontal Triangles there’s usually a thrust in the direction of the primary trend, which in this case is up. If a thrust up is underway as 01/14/22, it could last about a week and possibly reach major Fibonacci resistance in the 4840 to 4890 range. This target was first examined in the 11/10/21 blog “Possible S&P 500 – Price Topping Zone”.
The first FOMC meeting of 2022 is on 01/25/22 and 01/26/22.
If the SPX does not go up next week, a move below the SPX bottom at 4495.12 made on 12/03/21 would invalidate the Horizontal Triangle wave count.
