On 01/10/22 the S&P 500 (SPX) held above the rising daily trendline connecting the 12/03/21 and 12/20/21 bottoms. Today 01/12/22 the SPX pushed above the .618 Fibonacci resistance level of the 01/04/22 to 01/10/22 decline.
The daily SPX chart courtesy of Trading View illustrates the recent action.
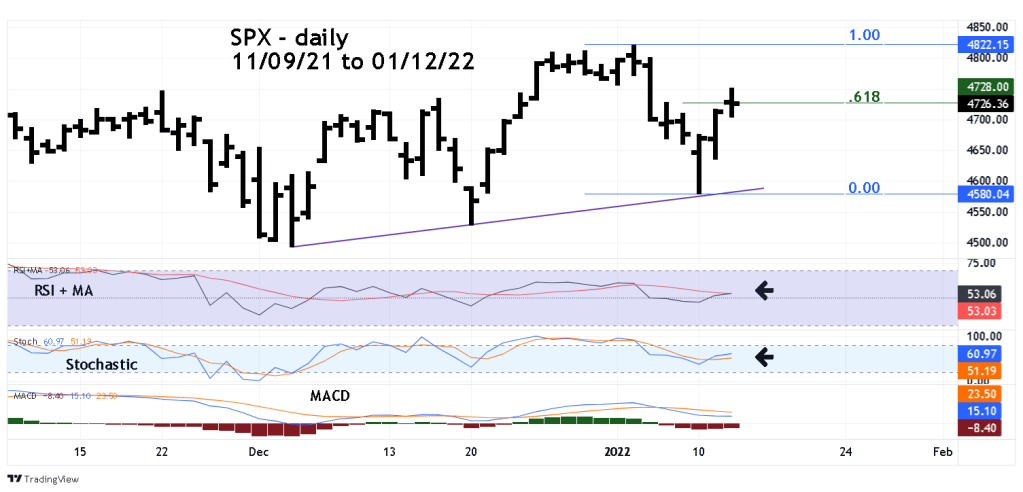
Additionally, today the RSI + MA had a bullish cross of the moving average – red line.
Daily Stochastic had a bullish crossover. MACD remains bearish.
The weight of bullish momentum evidence implies the SPX could make a new all-time high before the end of January 2022.
Within the next few trading days, the SPX could complete an Elliott wave pattern defining an important cycle point in the bull phase.
If this pattern completes, a future post will illustrate this potential cycle point – which could be the most important signal for US stocks in 2022.
