The presumed S&P 500 (SPX) – Elliott wave Horizontal Triangle illustrated in the 01/15/22 blog could still be forming.
The daily SPX chart courtesy of Trading View shows the recent price action.
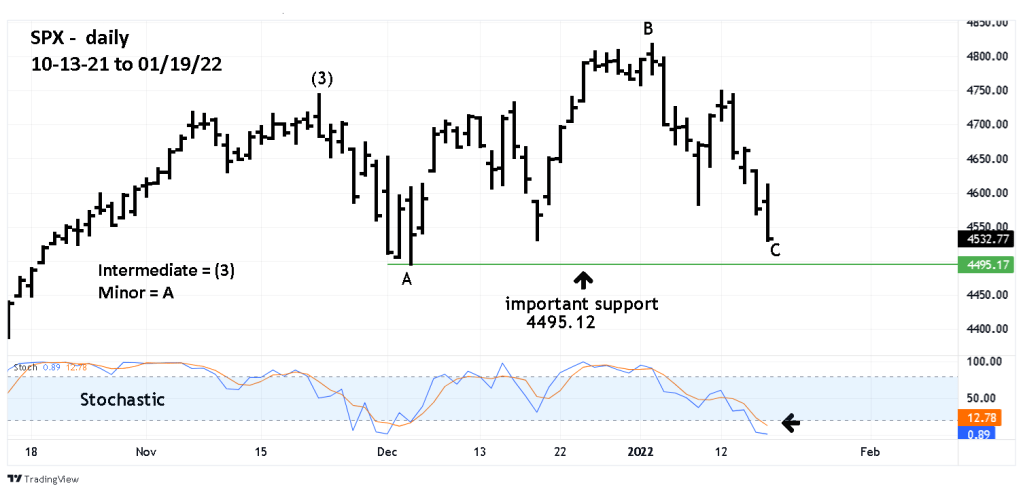
Its possible Minor wave “C” – down is forming. Both lines of daily Stochastic have reached the oversold zone implying that wave “C” may have ended near the close of trading on 01/19/22.
Important support is at 4495.12 a break below this level will eliminate the Horizontal Triangle wave count. A break below 4495.12 would also be strong evidence that a very important SPX top may have been made on 01/04/22.
If there’s a break below 4495.12, a blog will explain the significance of that level.
