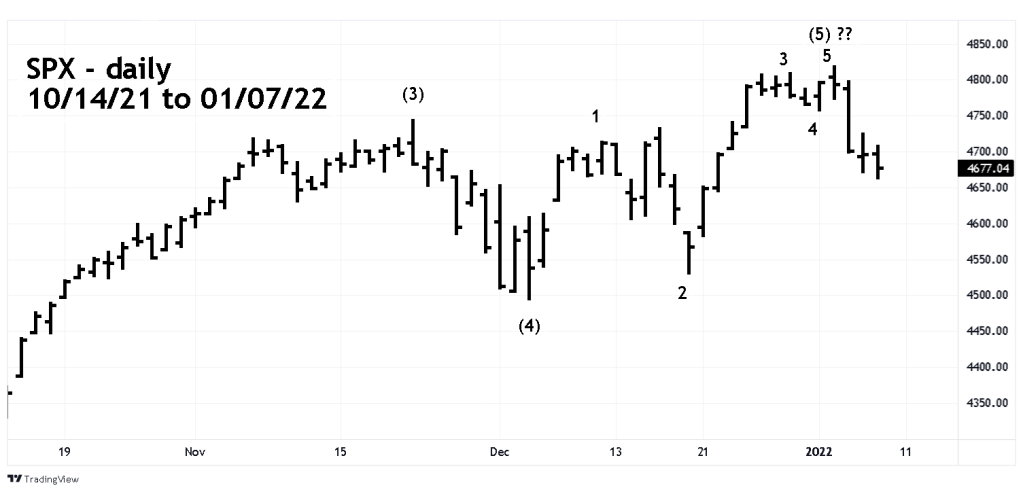
On 01/04/22 two trading days after a new moon the S&P 500 (SPX) completed what could be an Elliott – five wave impulse pattern from the 12/03/21 bottom. It could also be the final Intermediate degree wave up from the SPX 10/30/20 bottom, this wave count has been illustrated in several blogs.
The daily SPX chart courtesy of Trading View illustrates the recent price action.
Additionally, on 01/05/21 the Dow Jones Industrial Average (DJI) made a new all-time high unconfirmed by the other two main US stock indices. What I call a bearish “Rule of the Majority” signal.
What’s happened with US stocks in the first week of trading 2022 is a perfect example of a possible new year turn. Having a “Rule of the Majority” bear signal and what could be a new moon sell signal is compelling evidence a significant top could be in place.
However, there’s one factor missing from the bear case. Price.
Several blogs have noted that the growth rate of the SPX rally from March 2009 to April 2010 could have a Fibonacci relationship when added to the SPX 10/30/20 bottom. This relationship targeted SPX 4889 as a bullseye top. The lower leeway target zone is from 4890 to 4840.
The SPX high on 01/04/22 was 4818.62 well below the lower end of the target zone.
Robert Prechter’s 2003 book “Beautiful Pictures” illustrated dozens of major turns from 1921 to 2000 for the DJI that fell within Fibonacci leeway. Markets will turn wherever they want. While it’s a low probability that a major turn could happen outside a Fibonacci leeway zone, it can’t be dismissed.
The 12/29/21 blog Market Turns Near the Turn of a New Year” illustrated examples of US stock market turns within one week of the last trading day of the year. The action in the first trading day of 2020 is a perfect example of a year-end turn. However, there could be one more rally to the Fibonacci target zone.
Because the SPX could still reach 4840 to 4890 the safest course of action is to wait for further price before going short or long.
If a significant top is in place it implies at least a multi – month bear move that could present several opportunities to go short. The possibility of a muti-year bear market could have even more opportunities to short.
If a significant top is in place it implies at least a multi – month bear move that could present several opportunities to go short. The possibility of a muti-year bear market could have even more opportunities to short.
The persistence of the US stock market rally since March 2020 has been incredible and could have one more bullish surprise. Be patient, wait for what happens in the second trading week of 2022. This could give additional evidence for the trend in the coming months.
