The combined Point & Figure cluster and Fibonacci support noted in the prior blog has held.
The S&P 500 (SPX) 15 – minute chart courtesy of Trading View illustrates the move up.
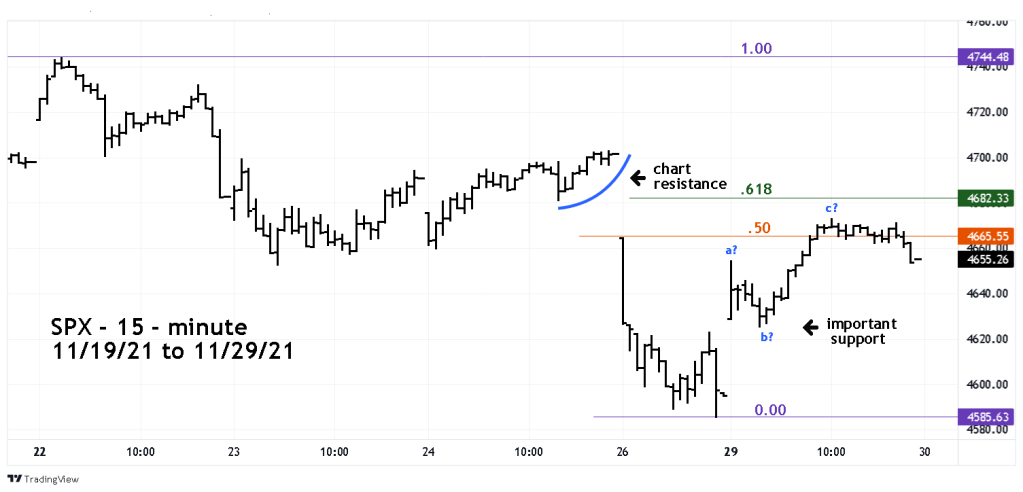
The rally on 11/29/21 retraced a little more than 50% of the decline from 11/22/21 to 11/26/21. The rally could be an Elliott wave – Single Zigzag pattern. This type of formation is a correction of the primary trend. If the SPX moves below the supposed “b” wave low at 4625.26 it could open the door for at least a move back to the 11/26/21 low.
If the SPX rally continues it needs to overcome first the .618 Fibonacci retracement level. Above that is potential chart resistance. If the SPX can move above chart resistance high at 4702.87 it implies a move to at least the all-time high.
