On 11/26/21 the report of a new Coronavirus variant triggered a global stock market selloff. The UK – 100 Index (UKX) was down 3.64%. The German Stock Index (DEU) was down 4.15%. The Hang Seng Index down 2.67% and the Nikkei 225 Index (NI225) was down 2.53%.
The US stock market as measured by the S&P 500 (SPX) was down 2.27% in a post-Thanksgiving holiday shortened trading session. The day after the Thanksgiving holiday is usually one of the slowest trading days because it’s always on a Friday and presumably stock fund managers take that day off. If the 11/26/21 SPX decline was made without large stock fund participation then the actions fund managers make on 11/29/21 could have profound consequences for the stock bull phase that began in March of 2020.
The 30- minute SPX chart courtesy of Trading View illustrates the rally from the 10/04/21 bottom.

Several blogs have noted that November is seasonally the most bullish month for US stocks. November usually ends with higher stock prices than the November opening. Counter seasonal moves can provide powerful evidence of a potential trend change. Please see what happened to the SPX subsequent to its bearish action in November 2007.
The SPX closed the 11/26/21 session below 2610.62 where it opened on 11/01/21. If there’s a significant decline on 11/29/21 it could be difficult for the SPX to close the month positive on 11/30/21.
There are several Elliott wave interpretations for the SPX rally from 10/04/21 to 11/22/21. As of the 11/26/21 close, it’s difficult to determine the best wave count. In this type of situation examine segments of a market action to discover potential Fibonacci relationships.
Measuring the SPX rally not from its primary bottom on 10/04/21 but from the secondary low on 10/11/21 to the primary peak on 11/22/21 targets a .382 retrace at 4585.72. The actual low on 11/26/21 was 4585.43 a bullseye hit.
Additionally, the SPX decline from 10/07/21 to 10/11/21 has a Fibonacci relationship with the 11/22/21 to 11/26/21 drop. The decline into 10/11/21 was 100.05 points the decline into the 11/26/21 bottom was 158.40 points. A Fibonacci ratio of 100.05/158.40 = .631 close to the Golden Fibonacci ratio of .618. If the low made on 11/26/21 holds it could mean the rally from 10/11/21 to 11/22/21 was wave “3”. However, the subdivisions of this rally don’t look like a five-wave impulse pattern. There are two interpretations for this movement, which depending on subsequent movements will be illustrated later.
Also note there is an Elliott wave interpretation that has the SPX 10/04/21 to 11/22/21 rally as a completed Intermediate wave (5) of the move up from the late October 2020 bottom. If this wave count is in effect, it implies a subsequent multi month decline of at least 20%.
Point & Figure charts compress market movements by focusing only on price action. Columns with “X” represent rallies. Columns with “O” represent declines. Point & Figure charts are especially useful in discovering support/resistance areas.
The SPX500 – one minute Point & Figure chart illustrates a potential support zone.
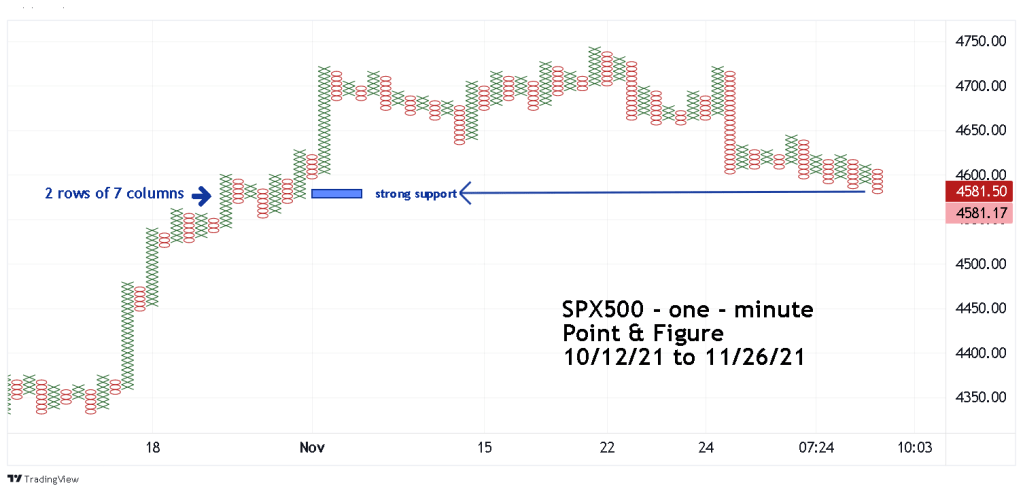
SPX500 is an index on trading.com that tracks the movements of the S&P 500 – E- Mini futures and has prices similar to the SPX. This allows for discovery of potential support/resistance zones beyond the SPX trading session.
On 11/26/21 SPX500 reached potentially strong support of two rows seven columns wide.
The combination of two Fibonacci coordinates and a Point & Figure cluster implies powerful support which could require powerful force to break. If US stock fund managers are selling on 11/29/21 it could trigger a decline of at least 2 to 3%. A drop of that magnitude could break the back of the bull market that began in March 2020.
If fund managers buy on 11/29/21 it could be the beginning of a move to a new SPX all-time high, or possibly just a brief bear market rally that terminates in two or three days.
What happens in the US stock market during the week of 11/29/21 to 12/03/21 could determine the fate of a bull market that began in March 2020 and possibly the secular bull market that began in March 2009.
