The 10/03/21 blog “Struggling to Go Lower – Part Three” noted the S&P 500 (SPX) on 10/01/21 went below the bottom made on 08/19/21. However, there were less NYSE – new 52 – week lows ($NYLOW) on 10/01/21 than on 08/19/21 – a bullish signal. The 10/03/21 blog also mention that while October was seasonally bearish for US stocks that the bottom could be made anytime in October. I speculated that a lower SPX bottom could be made on 10/08/21 with the monthly US payroll report. The SPX made a lower bottom on 10/04/21 with another $NYLOW bullish divergence, this ended the September to October correction.
On 11/22/21 the situation reversed. The daily $NYLOW chart courtesy of StockCharts.com updates the action of NYSE – new 52 – week lows.

With the SPX making a higher low, $NYLOW has exceeded the level recorded on 08/19/21 – a bearish divergence.
The Nasdaq Composite (IXIC) has an even more stunning bearish signal. The daily Nasdaq – new 52 – week lows ($NALOW) illustrates its action since mid – 2020.
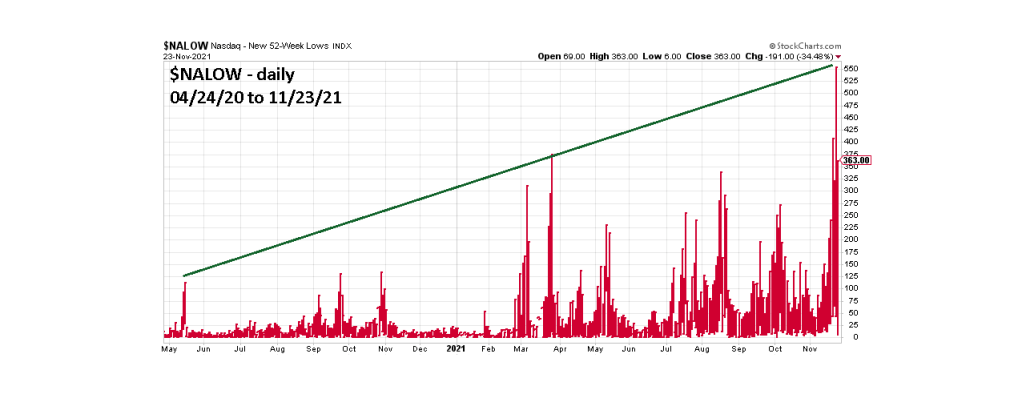
Amazingly after only a one-day decline $NALOW spiked to its highest level since the bull move began in March 2020.
On 11/22/21 both the SPX and IXIC made new bull market highs and ended the day down and at the lows of the day. This action by itself is a bearish signal. Could a major top for US stocks be in place as of 11/22/21? It’s possible, but If the longer-term Fibonacci time cycles are in effect US stocks could continue to make new highs into December 2021 – please see the 10/24/21 blog “Possible US Stock Market Top – December 2021”
Most likely the action of expanding new lows on 11/22/21 could be a pre-earthquake shock prior to a big US stock market earthquake beginning in December 2021. A big stock market earthquake could be at least a multi month decline of 20% or more from the all-time highs.
