The 10/24/21 blog “Possible US Stock Market Top – December 2021” focused on long-term Fibonacci time cycles that indicated US stocks could have a major top sometime in December 2021. The 11/10/21 blog “Possible S&P 500 – Price Topping Zone” illustrated long -term Fibonacci price analysis forecasting the S&P 500 (SPX) could have major resistance in the 4860 to 4890 area.
Evidence from recent SPX action reveals shorter term Fibonacci price analysis also targets SPX 4860 to 4890 as possible resistance. Before examining the possibility of further price gains we need to look at the bearish side of the coin.
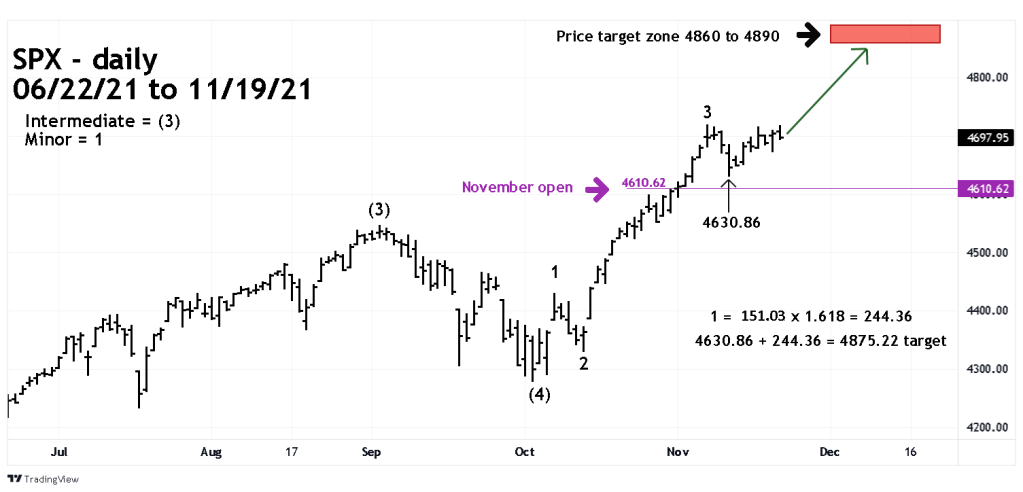
The daily SPX chart from June to November 2021 courtesy of Trading View illustrates recent price action.

On 11/19/21 the Nasdaq Composite (IXIC) made a new all-time high unconfirmed by the other two main US stock indices, SPX and the Dow Jones Industrial Average (DJI). I call this a “Rule of the Majority” signal – the truth is with the non-confirming indices. In this case a major top could have been made on 11/19/21 with the solo Nasdaq Composite all-time high.
Another potential bearish factor is based on seasonal patterns. November is seasonally the most bullish month for US stocks. Meaning, closing November lower than the open of November. The important number is SPX 4610.62, a November 2021 close below that level would be countercyclical and implies a larger bear move could be developing. Please examine what happened to the SPX subsequent to the November 2007 lower close.
Assuming the SPX can continue to rally, as of 11/19/21 it is within range of reaching the potential major resistance zone sometime in December 2021.
The SPX rally from 10/04/21 to 10/07/21 could be Minor wave “1” of Intermediate wave (5). Taking the length of this movement 151.03 points and multiplying by the Fibonacci ratio of 1.618 yields 244.36, added to what could be the Minor wave “4” bottom of 4630.86 targets SPX 4875.22 as a possible termination point for Minor wave “5”.
Within Elliott – five wave impulse patterns there’s usually a Fibonacci relationship between waves “one” and “five.”
The 11/10/21 blog illustrated that the SPX Primary wave “5” from March 2009 to April 2010 had a possible relationship with the SPX rally from October 2020 that targeted a Primary wave “5” peak at SPX 4890.
The 11/10/21 blog also noted that Intermediate wave (1) of Primary wave “5” which ran from October 2020 to February 2021 had a potential relationship with the SPX rally from October 2021 that targeted an Intermediate wave (5) top at 4860.
The possible Minor wave “5” top is in the middle of the two prior coordinates and could be the final piece of an Elliott wave/Fibonacci puzzle that began in March of 2009.