The 10/29/21 blog noted that the S&P 500 (SPX) reached short-term Fibonacci resistance, this blog focuses on the internal momentum of the US stock market.
The NYSE – new – 52 – weeks highs chart ($MAHX) courtesy of Barcharts.com shows the action since May 2021.

The SPX 09/02/21 all-time high had a significant bearish divergence vs. the reading in May 2021. On the recent rally the divergence continued with the SPX making a new all-time high on 10/25/21. The reading on 10/29/21 with the SPX making another all-time high new highs continued to deteriorate.
The SPX Bullish Percent Index ($BPSPX) courtesy of Stockchart.com also illustrates significant bearish divergences.
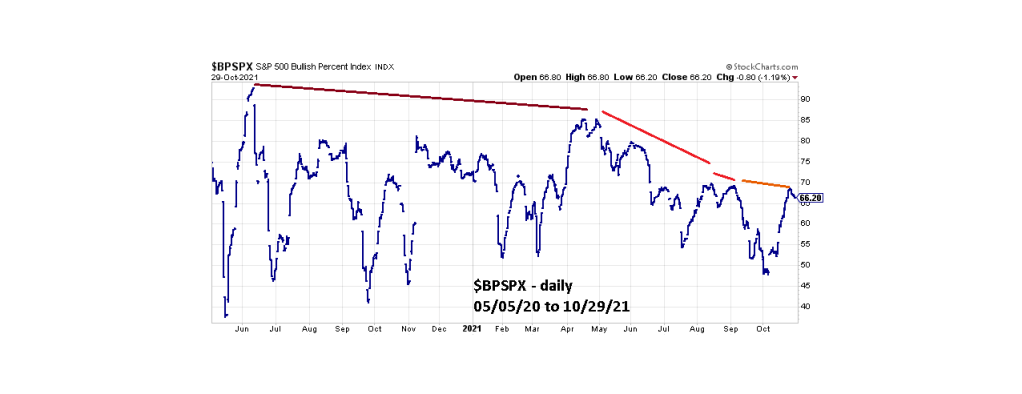
The Bullish Percent Index, is a breadth indicator that shows the percentage of stocks on Point & Figure buy signals. In this case the stocks within the SPX.
Not only is there a significant long-term bearish divergence, but there are also fascinating short-term bearish divergences. Note that at the 09/02/21 all-time high $BPSPX had a short-term bearish divergence vs. the August 2021 high. The reading on 10/26/21 diverged on the 09/02/21 reading and on 10/28/21 and 10/29/21 $BPSPX went down while the SPX went up.
Additionally, on 10/29/21 only 39% of the stocks in the NYSE Composite (NYA) advanced.
The readings in the prior two trading days from $MAHX, $BPSPX, and NYA are shockingly bearish implying a high probability of at least a short-term decline.
November is the most bullish months for US stocks – it closes the month higher than the open. There have been declines from the first though the second weeks of November with rallies in the second half closing the month higher. After a four-week rally and the SPX reaching short-term Fibonacci resistance, this November appears ripe for an opening decline.
Traders short 50% non-leveraged SPX related funds on the SPX open 11/01/21. Use a move above SPX 4640.00 as a stop loss on half of the position. Use a move above SPX 4660.00 as a stop loss on the second half of the position.
