The 10/22/21 blog “Hourly Bearish Divergences” noted that the S&P 500 (SPX) could be forming an Elliott wave – Running Horizontal Triangle, in this structure wave “B” marginally exceeds the Horizonal Triangle point of origin. In this case the SPX 09/02/21 peak. The most common Fibonacci relationship between waves “B” and “A” of a Running Horizontal Triangle is 1.236 to 1.00.
The hourly SPX chart courtesy of Trading View illustrates the Fibonacci relationship.
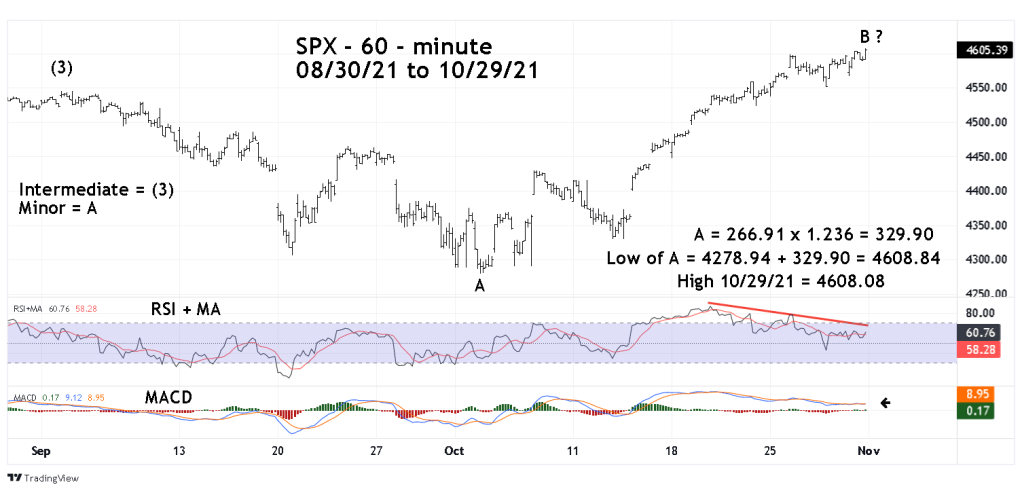
The SPX 10/29/21 top was a bulls eye hit.
Also note that as the SPX has continued to climb, the bearish divergences for the RSI and MACD have continued.
Internal momentum indicators are also showing bearish divergence, these will be illustrated in the next blog.
